

Bitcoin is currently trading around $66,400, which is almost 48% lower than its all-time high of $126,080 in October 2025. A technical analysis shows that draw a line in the sand for the correction.
According to a crypto analyst known as Leshka.eth, Bitcoin now approaching one price level that will determine whether this cycle survives or collapses in a complete reset. That limit is at $60,000, and whether it holds could determine Bitcoin’s price trajectory for the rest of the year.
Related reading
$60,000 as a major line of defense
According to crypto analyst Leshka.eth, the $60,000 price is now the most important zone for Bitcoin in the current market structure. This level is what the analyst describes as the final barrier that will determine whether a deeper correction will manifest itself in lower price levels.
Bitcoin has been trading around the low $70,000 region in recent sessions, with the past 24 hours marked by another 3.3% decline. While current positioning keeps it comfortably above the $60,000 level for now, the margin is no longer wide enough to ignore downside risks.
The weekly candlestick chart shared by the analyst shows how previous breakdowns of similar structures have led to price crashes. However, it is important to note that Bitcoin has not lost the $60,000 price level this cycle, with the early February crash bottoming out around $63,000.
This context makes the $60,000 level particularly important. It has continued to perform as a solid bottom over the past two months, allowing the higher price structure to be maintained between $63,000 and $76,000. Therefore, it would mean a loss of $60,000 that buyers have lost control of a key structural level that has supported the Bitcoin price throughout the current cycle.
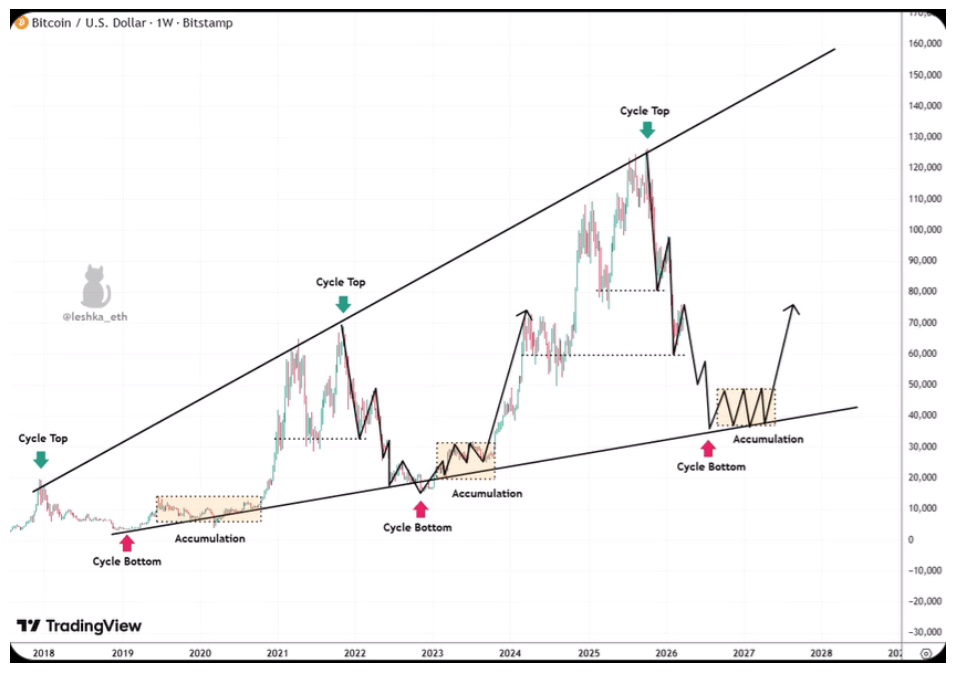
Bitcoin price chart. Source: @leshka_eth On X
The macro trendline in every Bitcoin cycle
The broader structure becomes clearer when we look at the long-term trendline drawn over multiple Bitcoin cycles. The trendline, which is drawn on the weekly candlestick chart from 2018 through a predicted 2028, connects the deepest cycle lows that formed during extended bearish price action.
Bitcoin topped out in late 2018, collapsed and dropped to the trendline in 2020, before entering a prolonged accumulation phase near the lows. Then it finally rose to the 2021 cycle top. The same structure repeated itself in the 2022 bear market: Bitcoin crashed from its peak, returned to the macro trendline in 2023, accumulated and launched a new cycle that took it to $126,080 in October 2025.
Related reading
That trendline is now around the $40,000 price level. According to the analyst, if there is $60,000 in cash, then the cycle survives. If it breaks, $40,000 will become the bottom and accumulation will begin again, Leshka.eth wrote in the post on X.
Featured image from Pexels, chart from TradingView