

Bitcoin price started a decent rise above the $70,000 zone. BTC is now consolidating and could target more gains if it clears $72,000.
- Bitcoin started a decent recovery wave above the $70,000 zone.
- The price is trading above $70,000 and the 100 hourly moving average.
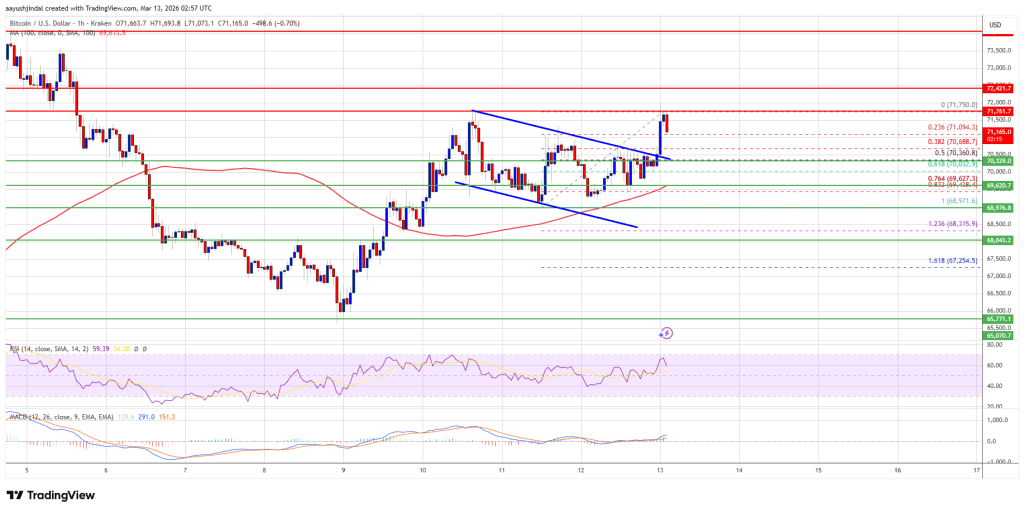
- There was a break above a bullish flag with resistance at $70,500 on the hourly chart of the BTC/USD pair (data feed from Kraken).
- The pair could fall again if it trades below the $70,400 and $70,000 levels.
Bitcoin price aims for steady gains
Bitcoin price remained high and extended its rise above the $69,200 level. BTC climbed above the USD 69,500 and USD 70,000 resistance levels.
There was a break above a bullish flag with resistance at $70,500 on the hourly chart of the BTC/USD pair. The pair even climbed above the $71,000 level. A high was reached at $71,750, and the pair is now consolidating gains near the 23.6% Fib retracement level from the recent upward move from the $68,971 swing low to the $71,750 high.
Bitcoin is now trading above $70,800 and the 100 hourly moving average. If the price remains stable above $70,400, a new increase could be attempted. Immediate resistance is near the $71,750 level. The first major resistance is around the $72,000 level.
A close above the USD 72,000 resistance could send the price rising further. In the mentioned case, the price could rise and test the USD 73,200 resistance. Any further gains could send the price towards the $74,000 level. The next barrier for the bulls could be $75,000.
Another drop in BTC?
If Bitcoin fails to rise above the USD 71,750 resistance zone, it could trigger another decline. Immediate support is near the $70,400 level or the 50% Fib retracement level of the recent upward move from the $68,971 swing low to the $71,750 high. The first major support is near the $70,000 level.
The next support is now near the $68,800 zone. Any further losses could send the price towards the USD 67,250 support in the short term. The key support now lies at $66,500, below which BTC could struggle to recover in the near term.
Technical indicators:
Hourly MACD – The MACD is now gaining speed in the bullish zone.
Hourly RSI (Relative Strength Index) – The RSI for BTC/USD is now above the 50 level.
Major support levels – USD 70,400, followed by USD 70,000.
Major resistance levels – $71,750 and $72,000.