
 Upside Awakens – Will Bulls Finally Reach $100?")
Solana started a new increase above the $88 zone. SOL price is now consolidating around $90 and could aim for more gains above the $92 zone.
- SOL price started a new upward move above the USD 85 and USD 88 levels against the US dollar.
- The price is now trading above USD 88 and the 100-hour moving average.
- There was a break above a key contracting triangle with resistance at $87 on the hourly chart of the SOL/USD pair (Kraken data source).
- The pair could extend gains if it breaks the $92 resistance zone.
Solana Price regains traction
Solana price started a decent increase after it broke above the $85 zone, just like Bitcoin and Ethereum. SOL climbed above the USD 88 level and entered a positive short-term zone.
There was a break above a key contracting triangle with resistance at $87 on the hourly chart of the SOL/USD pair. The price even broke the USD 90 resistance. It reached a high at $91.12, and the price is now consolidating gains. There was a small decline below the 23.6% Fib retracement level from the recent upward move from the $85.09 swing low to the $91.12 high.
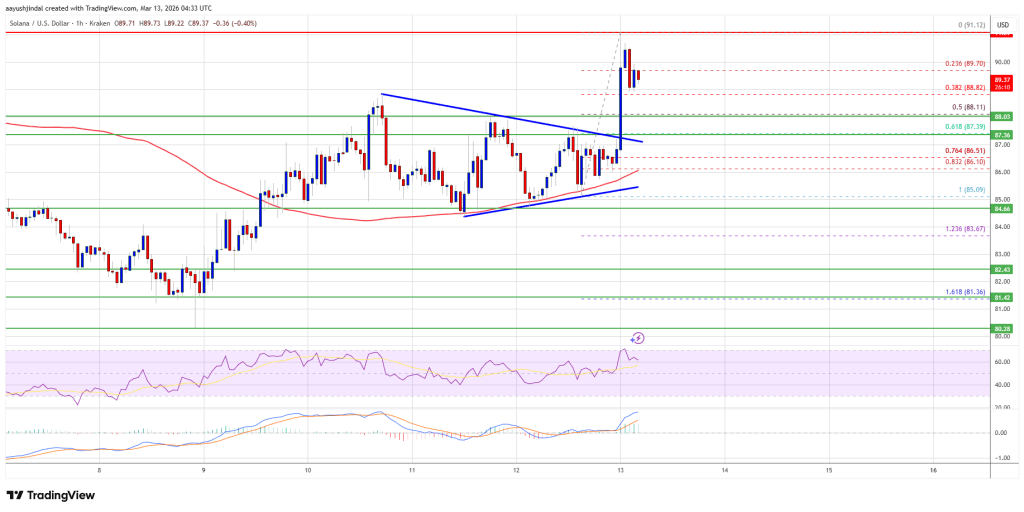
Solana is now trading above $88 and the 100-hour moving average. On the upside, the price is facing resistance near USD 91.20. The next major resistance is around the $92 level. The key resistance could be at $95. A successful close above the $95 resistance zone could set the pace for another steady rise. The next major resistance is $100. Any further gains could send the price towards the USD 102 level.
Downward correction in SOL?
If SOL fails to rise above the USD 91.20 resistance, it could trigger a fresh decline. The initial downside support is near the $88 zone. The first major support is near the $87.40 level and the 61.8% Fib retracement level of the recent upward move from the $85.09 swing low to the $91.12 high.
A break below the USD 87.40 level could send the price towards the USD 85 support zone. If there is a close below the $85 support, the price could fall towards the $78 support in the near term.
Technical indicators
Hourly MACD – The MACD for SOL/USD is losing pace in the bullish zone.
Hourly RSI (Relative Strength Index) – The RSI for SOL/USD is above the 50 level.
Major support levels – USD 88.00 and USD 87.40
Major resistance levels – $91.20 and $95.00.