

Bitcoin price is trying to recover above $103,500. BTC could continue to rise if it breaks the USD 106,500 resistance zone.
- Bitcoin started a decent recovery wave above the $103,500 support.
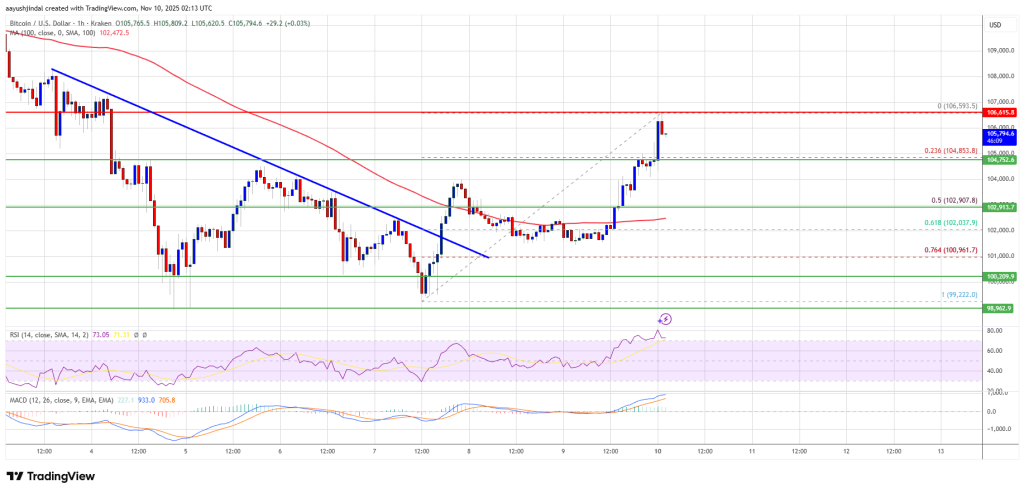
- The price is trading above USD 104,500 and the 100 hourly Simple Moving Average.
- There was a break above a key bearish trendline with resistance at $102,000 on the hourly chart of the BTC/USD pair (data feed from Kraken).
- The pair could continue to rise if it crosses the $106,500 zone.
Bitcoin Price Recovers 3%
Bitcoin price managed to stay above the $101,000 support level and initiated a recovery wave. BTC recovered above the USD 102,500 and USD 103,500 resistance levels.
There was a break above a key bearish trendline with resistance at $102,000 on the hourly chart of the BTC/USD pair. The pair even climbed above $105,000. Finally, it tested the USD 106,500 resistance zone. A high was reached at $106,593 and the price is now consolidating gains above the 23.6% Fib retracement level of the upward move from the $99,222 swing low to the $106,593 high.
Bitcoin is now trading above $104,000 and the 100 hourly Simple Moving Average. If the bulls attempt another recovery wave, the price may encounter resistance near the USD 106,000 level. The first major resistance is around the $106,500 level.
The next resistance could be $107,500. A close above the resistance at $107,500 could send the price higher. In the mentioned case, the price could rise and test the USD 108,000 resistance. Any further gains could send the price towards the USD 109,200 level. The next threshold for the bulls could be $109,800 and $110,500.
Another drop in BTC?
If Bitcoin fails to rise above the USD 106,500 resistance zone, it could trigger another decline. Immediate support is near the $104,850 level. The first major support is near the $104,200 level.
The next support is now near the $103,500 zone. Any further losses could send the price towards the $102,900 support in the near term. The key support is at $102,500, below which BTC could struggle to recover in the near term.
Technical indicators:
Hourly MACD – The MACD is now gaining speed in the bullish zone.
Hourly RSI (Relative Strength Index) – The RSI for BTC/USD is now above the 50 level.
Major support levels – $104,850, followed by $104,200.
Major resistance levels – $106,000 and $106,500.