

Bitcoin price quickly rose above the USD 62,500 resistance. BTC has even breached the USD 63,200 level and is now consolidating gains above USD 63,500.
- Bitcoin is gaining pace above the USD 63,200 resistance zone.
- The price is trading above USD 63,400 and the 100 hourly Simple Moving Average.
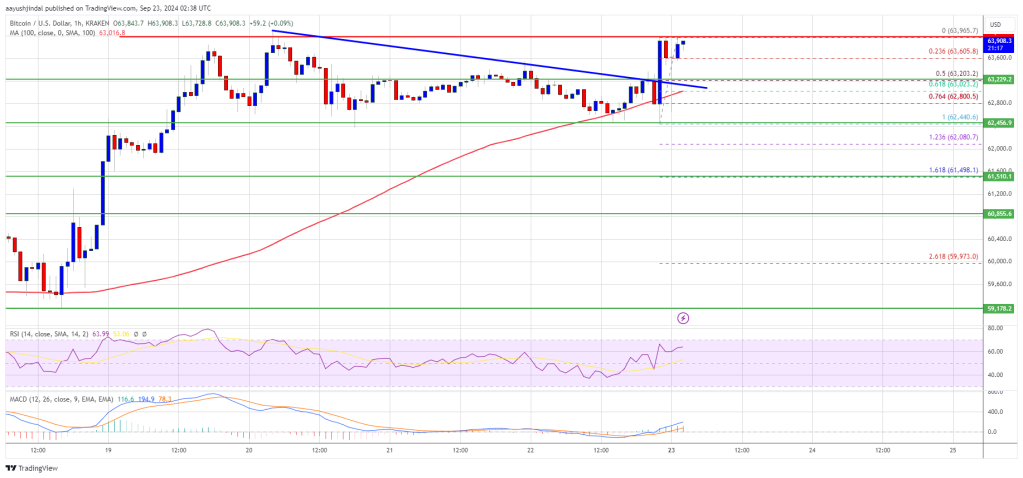
- There was a break above a connecting bearish trendline with resistance at $63,220 on the hourly chart of the BTC/USD pair (data feed from Kraken).
- The pair could extend gains if it remains above the $62,500 support zone.
Bitcoin price extends gains above $63,500
Bitcoin price extended its rise above the USD 62,500 level. BTC was able to break the USD 62,800 and USD 63,200 resistance levels to move further into a positive zone.
There was also a break above a connecting bearish trendline with resistance at $63,220 on the hourly chart of the BTC/USD pair. The bulls even pushed the price above the USD 63,500 level. It reached a high at $63,965 and the price is now consolidating gains.
There was a small move below the USD 63,750 level. The price fell and tested the 23.6% Fib retracement level of the upward move from the $62,440 swing low to the $63,965 high.
Bitcoin is now trading above $63,500 and the 100 hourly Simple Moving Average. On the upside, the price could encounter resistance near the $63,950 level. The first major resistance is near the $64,200 level. A clear move above the USD 64,200 resistance could push the price higher.
The next major resistance could be at USD 65,000. A close above the $65,000 resistance could bring more upside. In the mentioned case, the price could rise and test the USD 65,500 resistance.
Are dips supported in BTC?
If Bitcoin fails to rise above the USD 63,950 resistance zone, a downward correction could occur. The immediate downside support is near the USD 63,500 level.
The first major support is $63,200 and the 50% Fib retracement level of the upward move from the $62,440 swing low to the $63,965 high. The next support is now near the $62,500 zone. Any further losses could send the price towards the USD 61,500 support in the short term.
Technical indicators:
Hourly MACD – The MACD is now gaining speed in the bullish zone.
Hourly RSI (Relative Strength Index) – The RSI for BTC/USD is now above the 50 level.
Major support levels – USD 63,500, followed by USD 63,200.
Major resistance levels – $63,950 and $64,000.