

Bitcoin price started a downward correction from the USD 70,000 resistance. BTC is now correcting gains and could extend losses if it trades below $66,000.
- Bitcoin struggled near $70,000 and started a downward correction.
- The price is trading below $68,500 and the 100 hourly Simple Moving Average.
- There was a break below a key bullish trendline with support at $68,620 on the hourly chart of the BTC/USD pair (data feed from Kraken).
- The pair could extend losses if it fails to hold above the $66,000 support zone.
Bitcoin price drops again from $70,000
Bitcoin price extended gains above the USD 68,500 resistance zone. BTC even spiked towards the $70,000 resistance zone. However, it failed to stay near $70,000 and started a downward correction.
There was a move below the USD 68,500 and USD 68,000 support levels. Moreover, there was a break below a key bullish trendline with support at $68,620 on the hourly chart of the BTC/USD pair. The pair even fell below the $66,500 support zone.
It tested the $66,000 zone. A low is formed at $66,063 and the price is now consolidating losses. Bitcoin price is trading below $68,500 and the 100 Hourly Simple Moving Average.
On the upside, the price could encounter resistance near the USD 67,000 level. The first major resistance is near the $67,200 level or the 23.6% Fib retracement level of the downward move from the $69,985 swing high to the $66,036 low. A clear move above the USD 67,200 resistance could push the price further higher in the coming sessions.
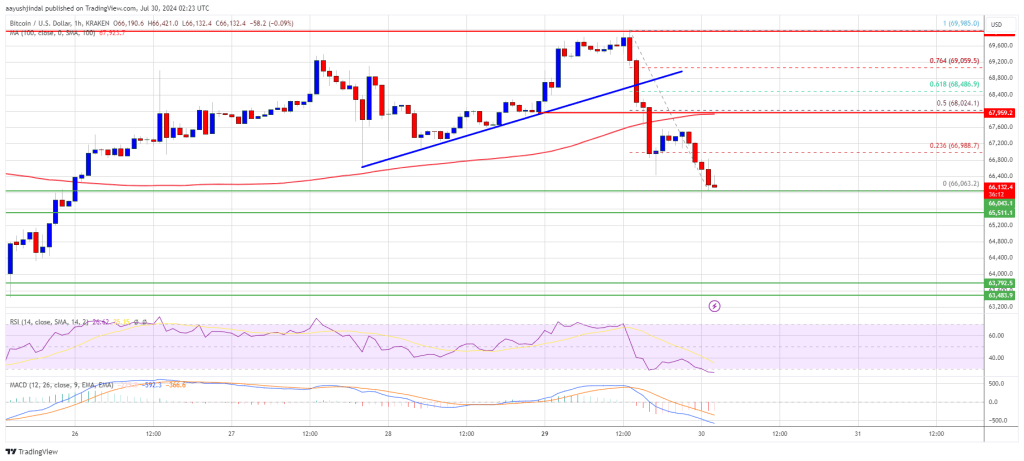
The next major resistance could be $68,000 or the 50% Fib retracement level of the downward move from the $69,985 swing high to the $66,036 low. The next big hurdle is at $68,500. A close above the resistance at $68,500 could trigger bullish moves. In the mentioned case, the price could rise and test the USD 70,000 resistance.
Lose more in BTC?
If Bitcoin fails to recover above the USD 67,200 resistance zone, it could trigger another decline. The immediate downside support is near the $66,000 level.
The first major support is at $65,500. The next support is now near $65,000. Any further losses could send the price towards the $63,500 support zone in the near term.
Technical indicators:
Hourly MACD – The MACD is now gaining speed in the bearish zone.
Hourly RSI (Relative Strength Index) – The RSI for BTC/USD is now below the 50 level.
Major support levels – USD 66,000, followed by USD 65,500.
Major resistance levels – $67,200 and $68,000.