
 recovery underway, but momentum still needs stronger follow-through")
Solana started a recovery wave above the $125 zone. SOL price is now consolidating and facing hurdles near the $135 zone.
- SOL price started a decent recovery wave above USD 125 and USD 128 against the US dollar.
- The price is now trading above $130 and the 100-hour moving average.
- A bullish trendline is forming with support at $130 on the hourly chart of the SOL/USD pair (Kraken data source).
- The price could continue to rise if $135 and $140 are cleared.
Solana Price strives for recovery
Solana price remained stable and started a decent recovery wave above $125, just like Bitcoin and Ethereum. SOL was able to climb above the USD 130 level.
There was a move towards the 50% Fib retracement level of the downward move from the $145 swing high to the $121 low. Furthermore, a bullish trendline is forming with support at $130 on the hourly chart of the SOL/USD pair.
Solana is now trading above $130 and the 100-hour moving average. On the upside, immediate resistance is near the $135 level or the 61.8% Fib retracement level of the downward move from the $145 swing high to the $121 low.
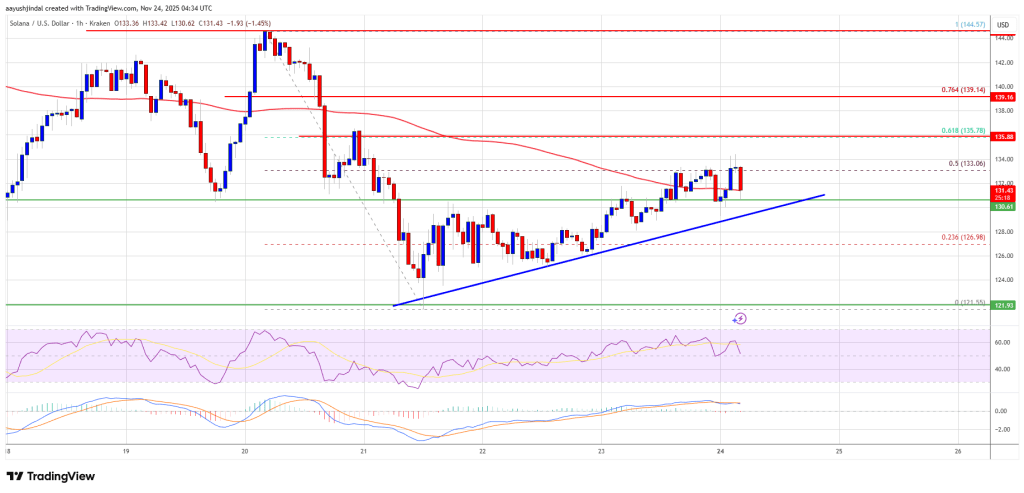
The next major resistance is around the $140 level. The main resistance could be at USD 145. A successful close above the $145 resistance zone could set the pace for another steady rise. The next major resistance is $155. Any further gains could send the price towards the USD 162 level.
Another drop in SOL?
If SOL fails to rise above the USD 135 resistance, the price could continue to decline. The initial downside support is near the $130 zone. The first major support is near the $127 level.
A break below the $127 level could send the price towards the $124 support zone. If there is a close below the $124 support, the price could fall towards the $120 zone in the near term.
Technical indicators
Hourly MACD – The MACD for SOL/USD is gaining speed in the bullish zone.
Hourly RSI (Relative Strength Index) – The RSI for SOL/USD is above the 50 level.
Major support levels – USD 130 and USD 124.
Major resistance levels – $135 and $140.