

Bitcoin ended the week of June 5, 2026 down almost 20%, the highest single-week percentage decline since the FTX collapse in November 2022. The last time the market saw a candle this red was during the cycle bottom.
This time though the current setup is more complicated, because Bitcoin responds to a combination of institutional selling pressure, ETF weakness and declining confidence after a failed recovery attempt above $82,000.
Related reading
Bitcoin’s decline brings back the FTX equation
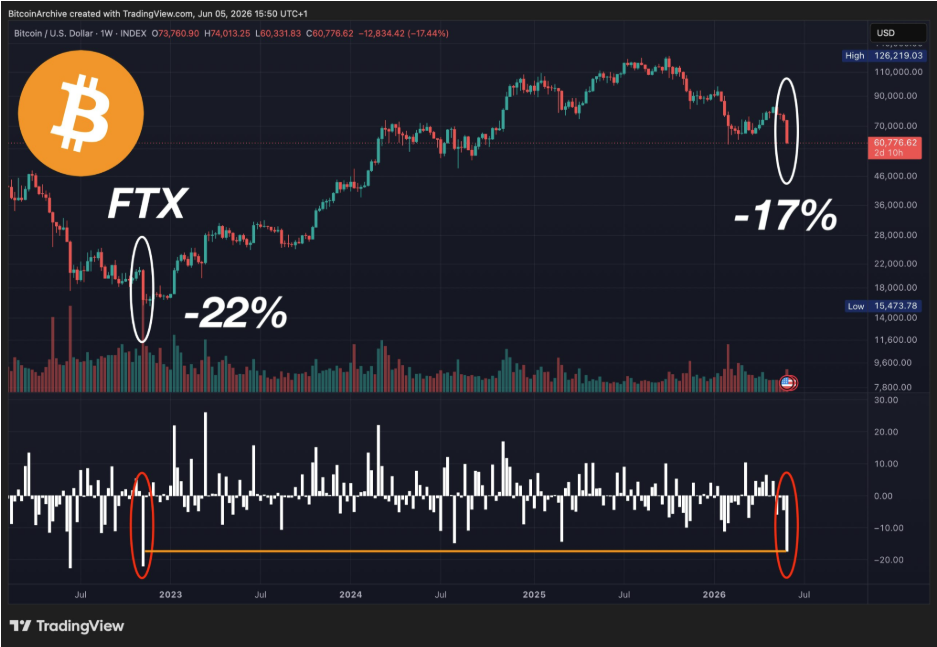
Bitcoin’s price action in the first week of June was one of the most remarkable weeks in history. BTC opened the week around $73,760, briefly rose to $74,092 and then fell to a low of about $59,130according to data from TradingView.
This move translates into a decline of approximately 19.5% from weekly open to low and 20.1% from high to low, making this Bitcoin’s worst weekly percentage decline since the 2022 FTX crash, when the price fell approximately 22% in one week.
However, there is also a note about where the candle appears in the market structure. During the FTX collapse, the violent weekly move came after months of selling pressure and ended close to the final bottom of the bear market. The current decline also occurs after Bitcoin has already lost a major some of its value from its all-time high above $126,000 in October 2025.
At the time of writing, Bitcoin is trading at $62,150, putting it about 50.7% below that peak. The similarity does not guarantee that the market has reached a bottom, but it does raise the possibility of the latest weekly price crash happening moves to the kind of final washout zone that followed the FTX crash. This angle is overlooked by many analysts, especially when it comes to different forecasts still point to a long-lasting one bear market that could extend until at least the fourth quarter of 2026
Bitcoin is extremely undervalued
Crypto analyst Darkfost noted that Bitcoin has now fallen below the 4% quantile on the Bitcoin Porkopolis Power Law Quantile Regression model. The chart places Bitcoin’s current quantile around 3.9%, meaning the asset is trading in a zone that has appeared during less than 4% of its historical price action relative to its long-term growth curve.
The Power Law model is a long-term valuation model that can also be used for a reversal signal. Every previous instance of the quantile oscillator reaching this level, visible in the 2015, 2018/2019, and 2022 bottom, preceded notable multi-year recoveries.
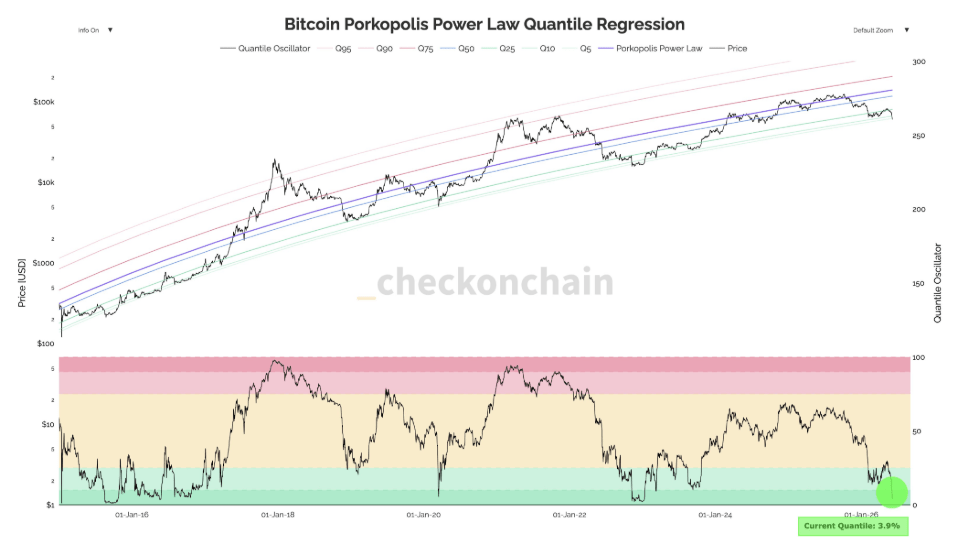
Bitcoin Power Law Regression. Source: @Darkfost_Coc On X
Related reading
Bitcoin could remain undervalued for longer than traders expect, especially if momentum is weak and there is forced selling. Still, the metric shows that Bitcoin is now much closer to the lower regression bands than the overheated upper bands during previous cycle peaks.
Featured image from Pexels, chart from TradingView