

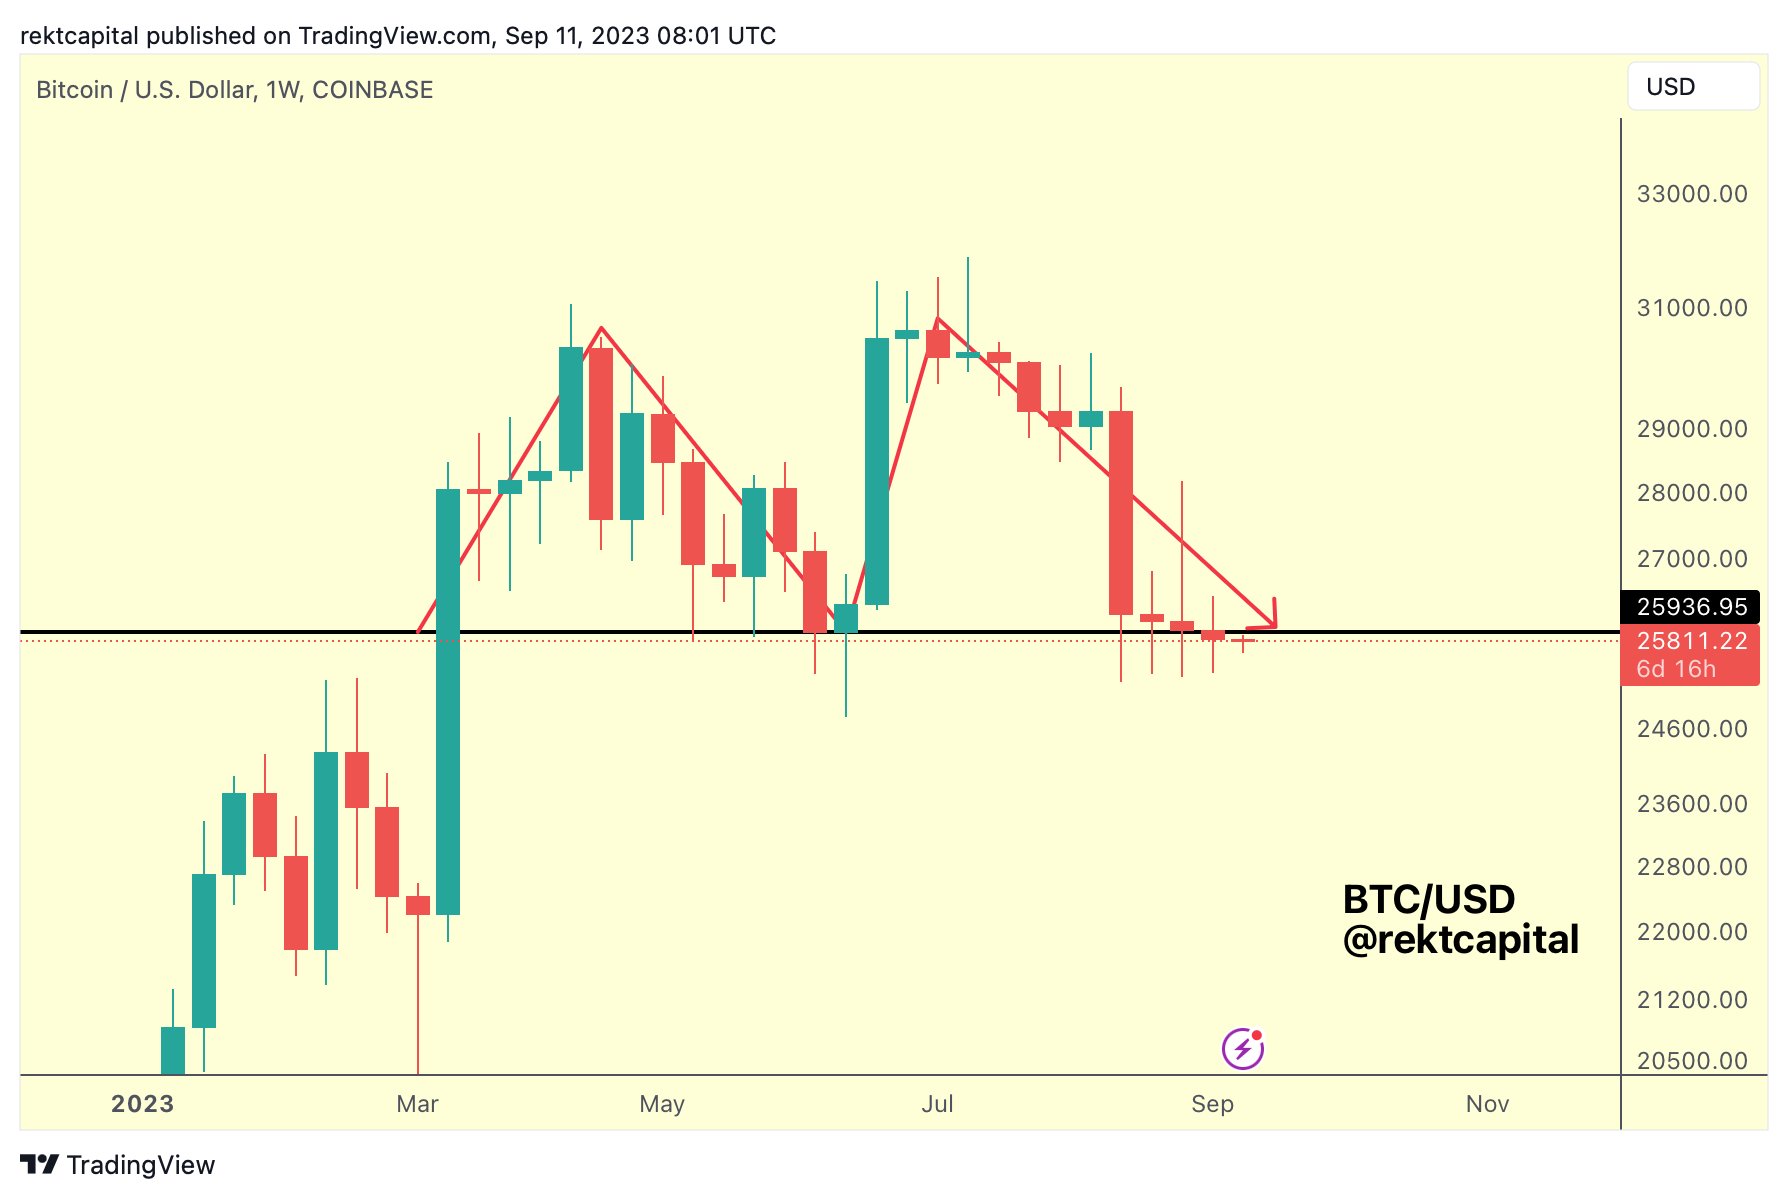
Bitcoin price’s weekly close below the $26,000 mark yesterday has raised concerns among analysts and traders. This move could potentially signal a further decline for the leading cryptocurrency as it appears to be the first step towards confirming a double top formation on the weekly chart.
Rekt Capital, a prominent figure in the field of crypto analysis, took to Twitter part his insights, stating: “BTC has officially closed weekly below the support of ~$26,000. Technically, BTC has started the first step in the process of validating this Double Top formation. Convert $26,000 into new resistance and the collapse will likely be confirmed.”
How low can the Bitcoin price fall?
Remarkably, this is not the first time that Rekt Capital has expressed concerns about this price level. As early as August 7, the analyst warned: “If BTC falls to $26,000 in mid-September, a double top could form. A breakdown starting at $26,000 would confirm the Double Top.”
Diving deeper into potential price movements, Rekt Capital has speculated that a breakout of the $26,000 base could see Bitcoin tumble towards the $22,000 region. The analyst emphasized the importance of watching the price action this week, noting: “If we see a weekly close below $26,000, followed by a rejection above $26,000, then we are likely to see a confirmed breakdown of this double top.”
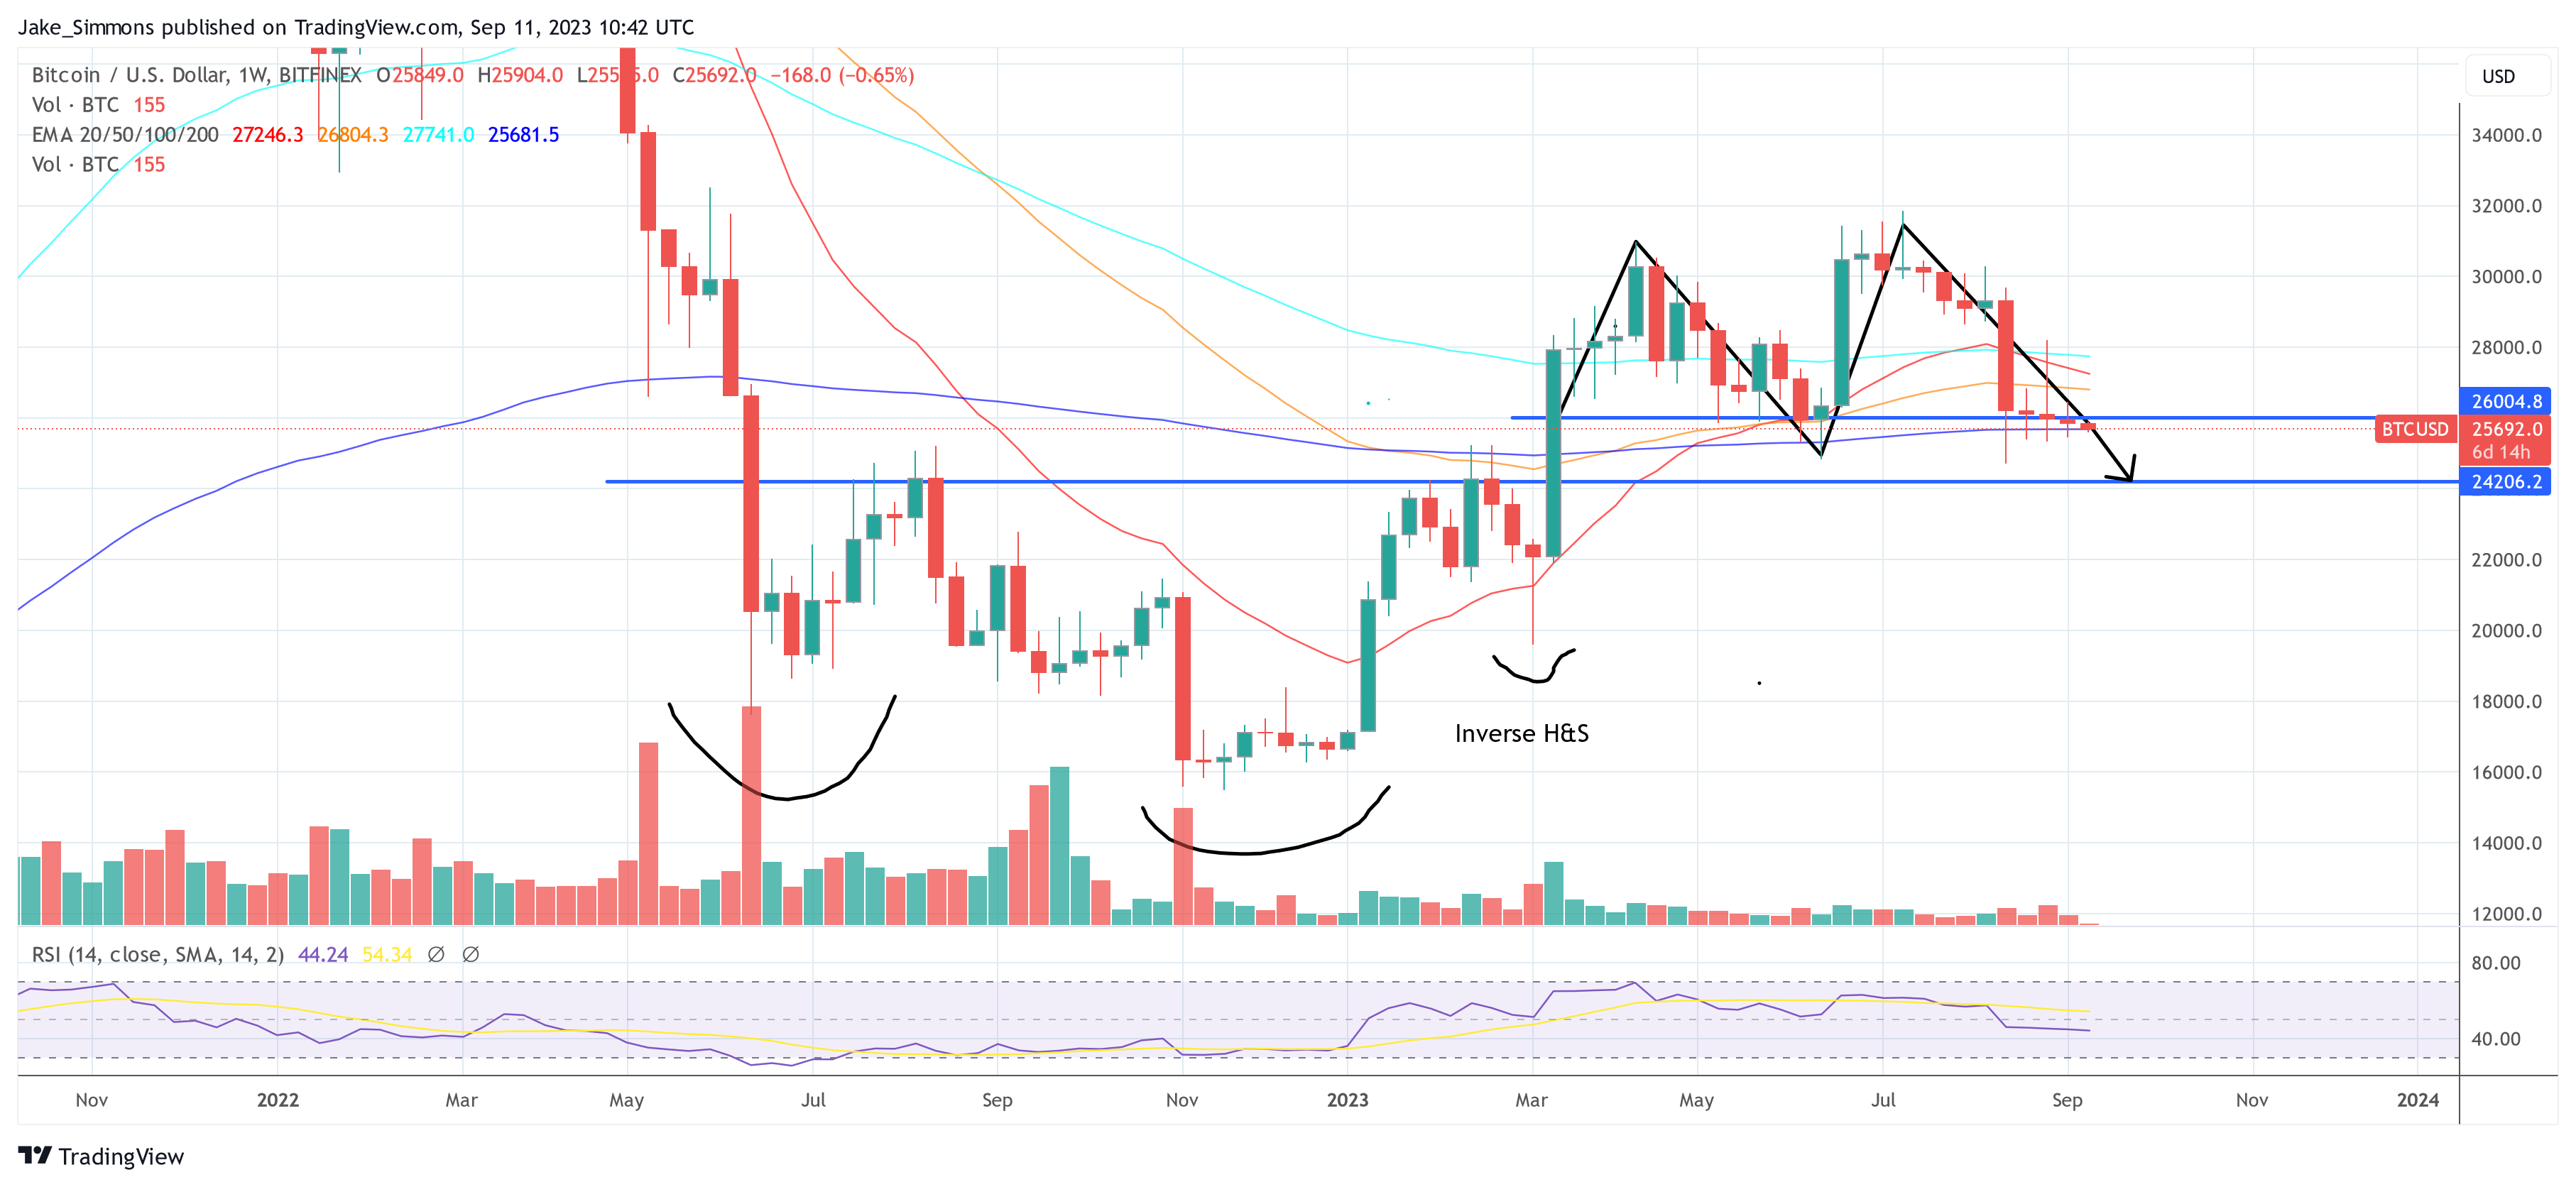
However, it is not all doom and gloom. Rekt Capital also highlighted the dangers of becoming too bearish, advising traders: “So it is very important not to get caught in these downside factors (below $26,000).” On a more positive note, the analyst pointed to the inverse head-and-shoulders pattern on Bitcoin’s weekly chart, which occurred in mid-March this year, indicating that a retest of the neckline, around $24,000, will mark the low of the upcoming movement of Bitcoin could indicate.
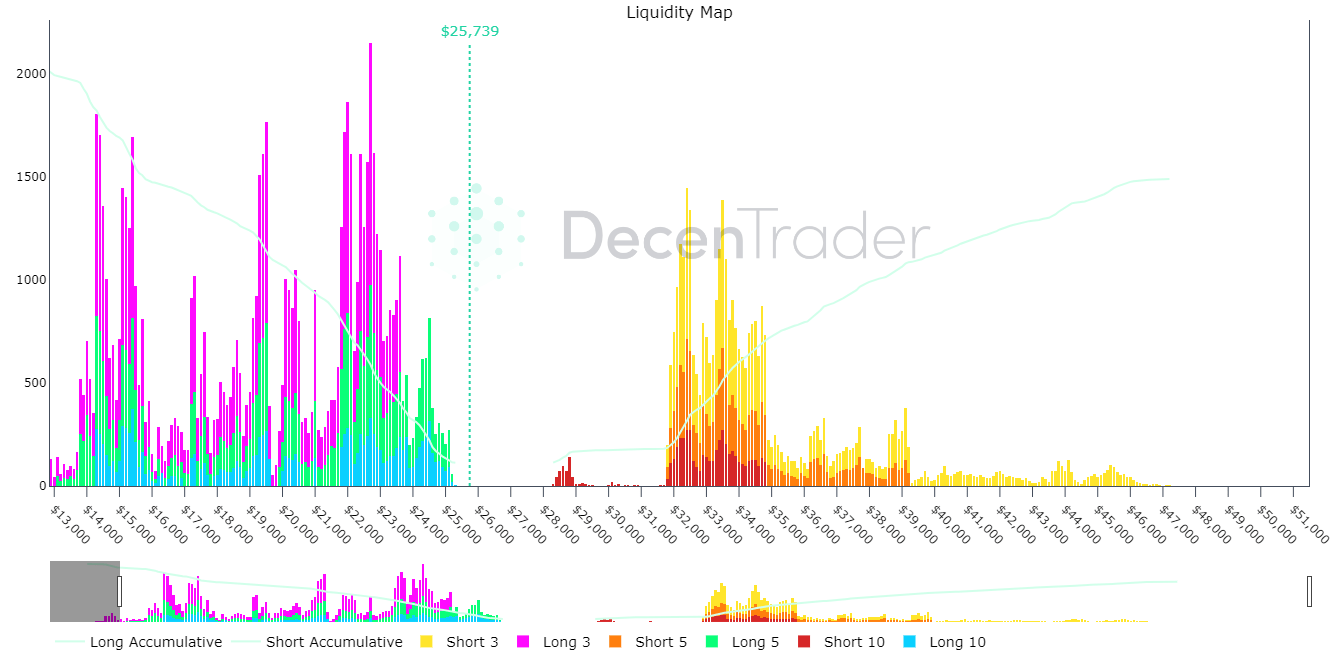
Decentrader, a crypto intelligence platform, weighed about current market conditions, tweeting: “The market is currently experiencing the most sustained period of #bitcoin on-chain losses since the bear market lows. Is this a buy-the-dip opportunity or the start of a deeper pullback?”
They further highlighted potential price movements, saying: “Bitcoin liquidity chart: There is a significant amount of 3x, 5x, 10x liquidity from $23,500 to $21,600. IF the price were to drop to $23,500, we could see a fairly rapid liquidity escalation that could quickly push the price down.”
Final correction?
Michaël van de Poppe, another esteemed analyst, provided a comprehensive historical perspective. He emphasized the importance of September as a historically challenging month for Bitcoin, saying: “There is a level that #Bitcoin must maintain to avoid a significant crash. Bitcoin is currently holding a significant level of support. It is around the $25,500 mark.”
From de Poppe dug into the historical and cyclical aspects of Bitcoin’s price movements. He emphasizes that the months of August and September, especially in a year leading up to the halving, have traditionally been tough for Bitcoin. In August 2015, Bitcoin underwent a substantial correction towards the 200 EMA, but managed to remain above it. A similar pattern was observed in August 2019, with a significant correction, followed by a smaller one in November 2019.
Van de Poppe drew parallels between the current market cycle and that of 2015, suggesting that given the influx of new institutional participants, the current market could mirror the 2015 cycle. If this correlation holds, the current downturn could be the last correction before a possible recovery.
At the time of writing, BTC was trading at $25,692.
Featured image from iStock, chart from TradingView.com