

Bitcoin seemed to be hovering safely above the support just before, but today the picture has changed as the price has suddenly crashed to $42,500.
Bitcoin has crashed by more than 6% in the last 24 hours
Bitcoin had started 2024 with sharp bullish momentum as the market looked with hopeful eyes to the potential ETF approvals. The asset was only at the $45,000 level not seen since April 2022 for a few days before the price suddenly crashed.
The chart below shows how cryptocurrency has performed in recent days.
Looks like the coin's price has plummeted during the last 24 hours | Source: BTCUSD on TradingView
During this plunge, Bitcoin briefly bottomed below $41,500, but the cryptocurrency has since seen a slight rebound as the price now trades around the $42,500 level.
As is usually the case, the rest of the sector has also fallen along with the original digital assets, with most coins seeing even bigger declines.
Just before this crash, Bitcoin was hovering above a critical support line and seemed poised to continue its recent bullish momentum.
Bitcoin had broken above an ascending triangle pattern during the recent rally
In a after at Below is the chart the analyst shared in the post.
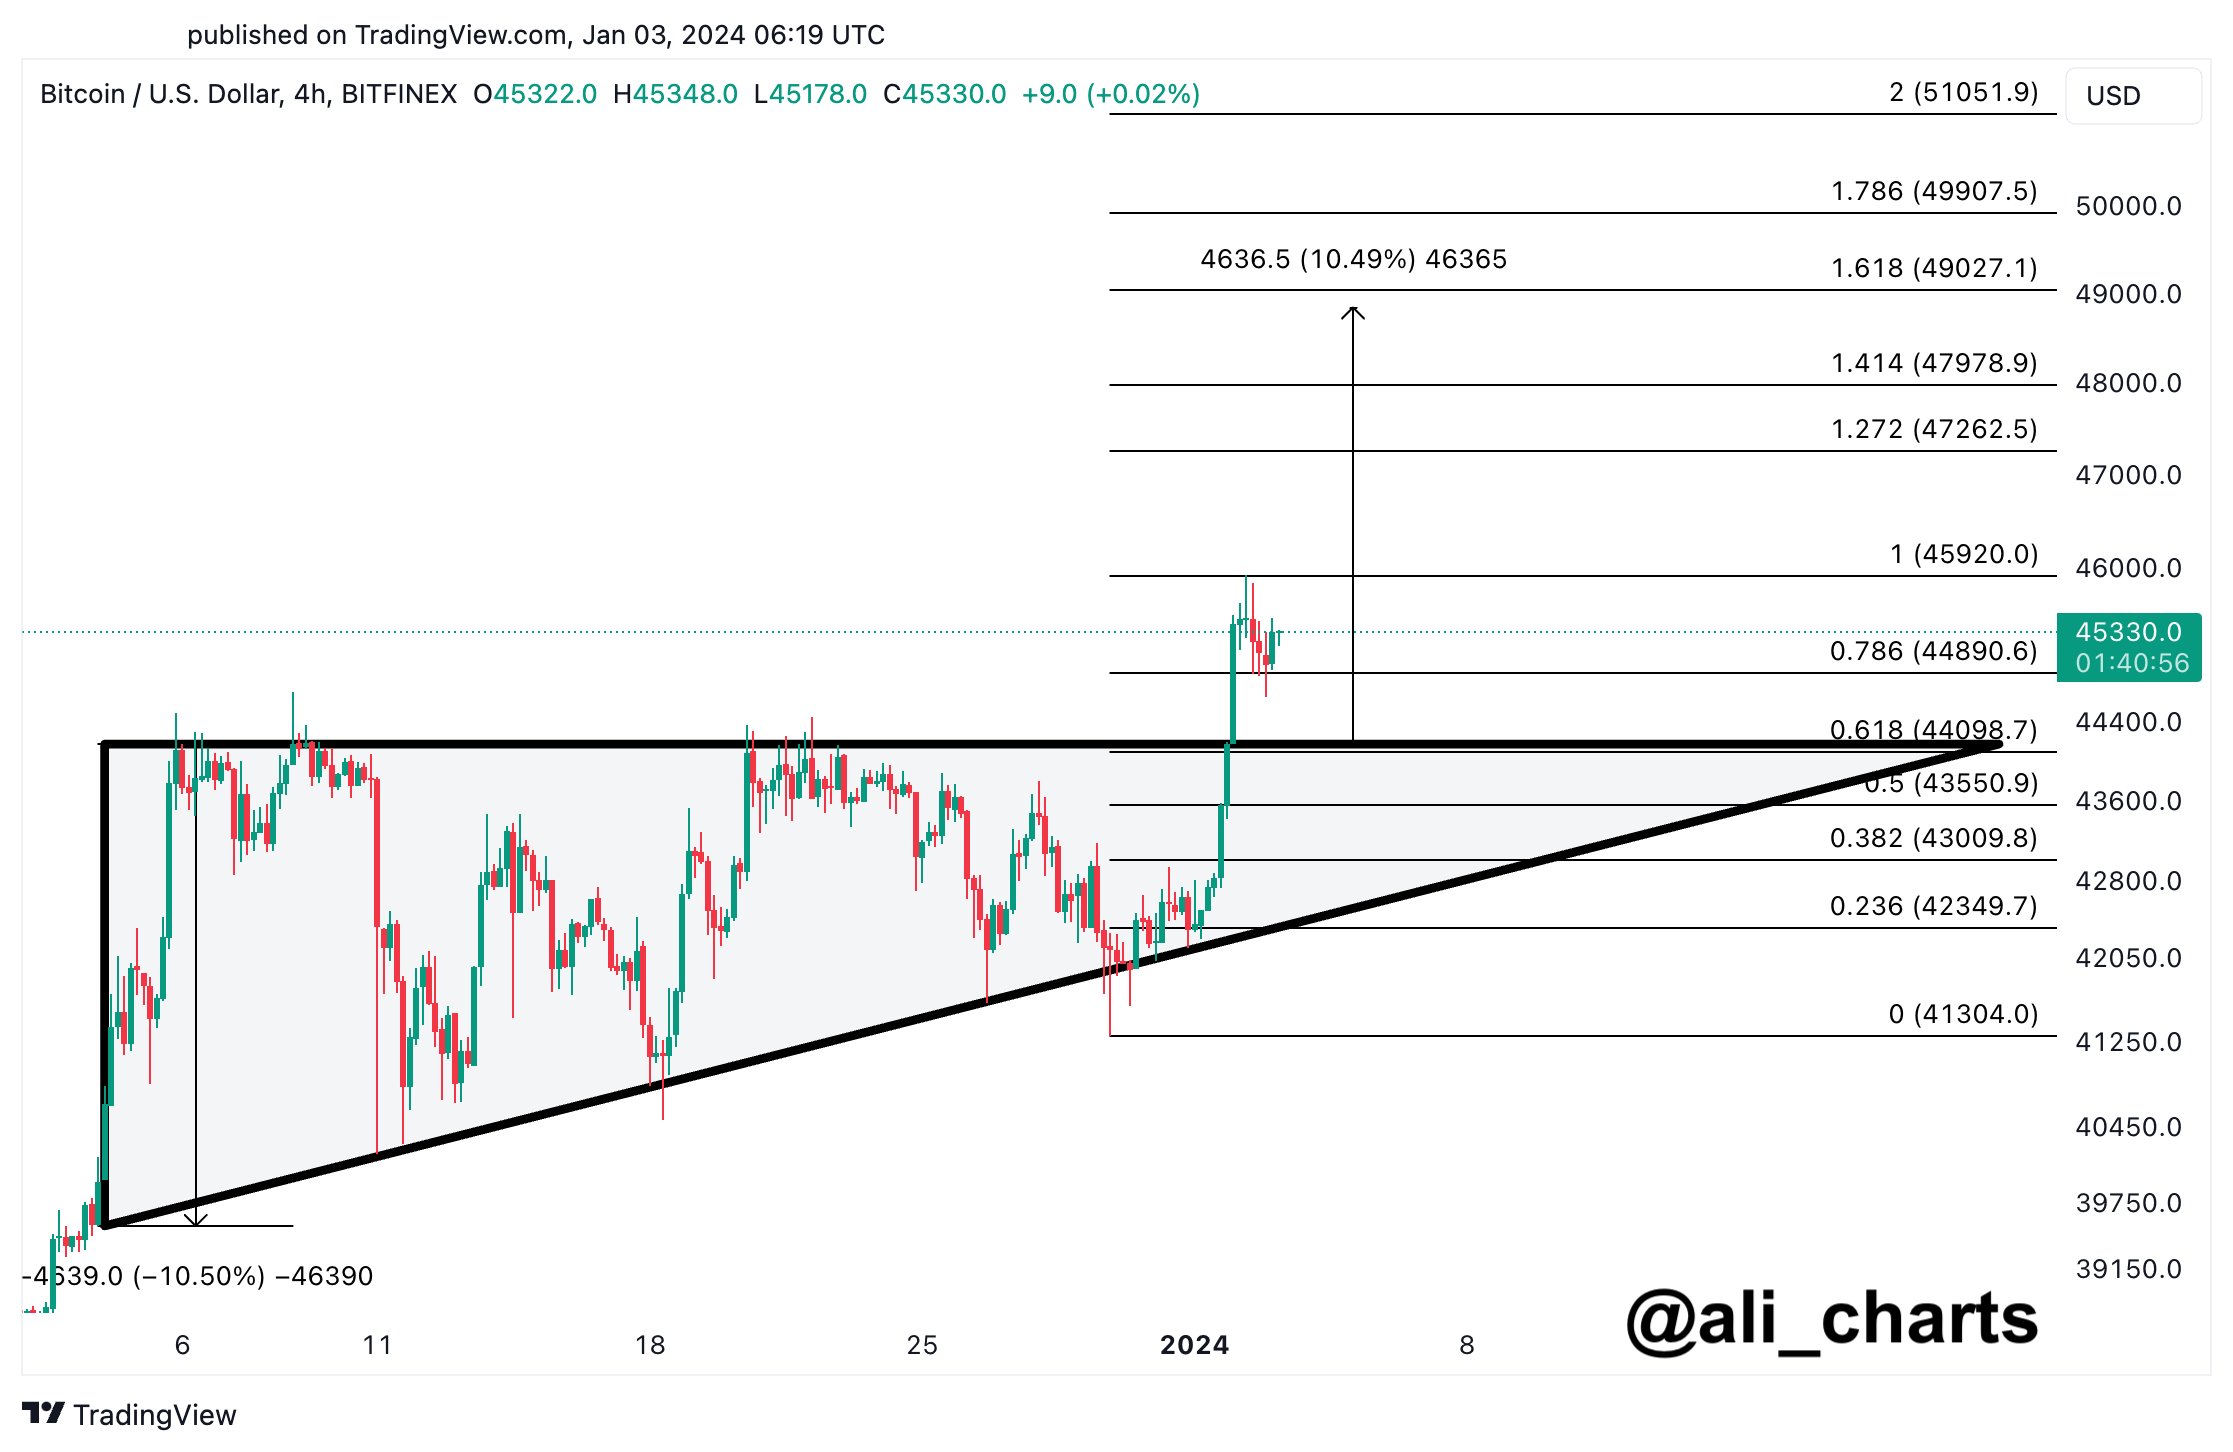
The pattern that had formed in the 4-hour price of the cryptocurrency | Source: @ali_charts on X
In the chart, Ali highlighted an ascending triangle pattern that Bitcoin seemed to have successfully broken out of with the price increase. An “ascending triangle” refers to a continuation pattern of two trend lines that form a triangular shape.
One of the trend lines is a horizontal level created by connecting the asset’s highs, while the other is a diagonal line connecting higher lows. The pattern is “rising” in its name while the overall consolidation between these two trend lines is narrowing to the upside.
Typically, when the price retests the horizontal level, it may encounter some resistance and form a local top. If resistance is broken, it could be a sign that the asset will now show continued upward momentum.
Likewise, the diagonal line is usually a support point for the asset, and persistent breaks below it can be worth paying attention to as they could indicate that a bearish trend is taking over.
The chart shows that Bitcoin had previously gained some distance against the triangle above and appeared to find support at the Fibonacci ratio of 0.786, which is around $44,900 for the asset.
Ali had noted that if sustained buying at this support continues, Bitcoin could potentially rise to the $49,000 level. But it has emerged that the market had other plans for the cryptocurrency as its price has fallen well below this support level.
Featured image of Kanchanara on Unsplash.com, charts from TradingView.com
Disclaimer: The article is for educational purposes only. It does not represent NewsBTC’s views on buying, selling or holding investments and of course investing involves risks. You are advised to conduct your own research before making any investment decisions. Use the information on this website entirely at your own risk.