

Bitcoin has climbed back to a key resistance zone on the chain, but according to Glassnode, this move still looks more like a fragile recovery than the start of a fully convincing trend shift. In its latest The Week On-chain report, the analytics firm said Bitcoin was trading around $74,000, about 5.2% below the True Market Mean of $78,100, a level it described as the key test for the market in the near term.
Glassnode is central argument is that the market has improved enough to keep the rally alive, but not enough to eliminate the structural risks. Spot market demand has recovered, ETF flows have turned positive again and institutional exposure is starting to rebuild. Yet profit-taking is increasing, the positioning of derivatives remains cautious and participation is still unevenly distributed across platforms and investor groups.
Glassnode Marks Vulnerable Bitcoin Rally Near Major Resistance
The report states that Bitcoin “has been gradually moving higher and is now trading near $74,000, about 5.2% below the true market average, mapping the cost basis of active supply.” It added that while the price has not yet broken above that threshold and has maintained it, “the likelihood of a peak towards and possibly above it in the medium term remains significant.” That puts the market in a tricky position: close enough to resistance for traders to focus on a breakout, but not yet strong enough to suggest the ceiling has actually given way.

One of the main reasons why Glassnode does not fully endorse the move is the behavior of short-term holders. The company highlighted the share of short-term holders’ supply of profits, which measures how much recently acquired supply rests on unrealized profits. Historically, local tops in bear market rallies have often formed when that figure approaches its statistical average of around 54.2%. Currently it stands at 43.2%.
Related reading
That means the rally may still have some room before reaching a more typical depletion zone, according to the report. But it is also a reminder that Bitcoin is entering an area where distribution pressures tend to increase, especially as newer market participants begin to use force to reduce risk.
Glassnode already sees that process underway in broader realized profit-taking metrics. The 30-day EMA of the realized profit/loss ratio is now 1.16, a value above 1 that indicates that realized gains exceed realized losses. In the company’s words, “the current reading of 1.16 confirms that investors are broadly using the current rally as an opportunity to exit breakeven positions or capture tight profit margins. While not an immediate reversal signal, a sharp spike in this ratio during a bear market rally has historically been a cautionary distribution indicator rather than a true recovery in demand.”
That distinction runs throughout the report. The rebound is real, Glassnode suggests, but the character of the move still matters. For the rally to evolve into something more sustainable, the market would need to absorb the selling pressure and build support above $78,100, not just trade on it.
Off-chain data tells a similar story. The cumulative spot market volume delta has improved sharply since the February capitulation, but the demand profile remains selective. Binance-led buying has surpassed Coinbase, indicating stronger participation from offshore and retail-driven segments than the institutional cohort often associated with Coinbase flows. Glassnode called this difference notable, arguing that sustained rallies typically require broader involvement from both sides of the market.
Institutional proxies have also improved, albeit cautiously. CME futures open interest has started to recover from local lows, and US spot ETF assets under management have moved higher after a period of outflows. Still, neither series has returned to previous highs, which Glassnode says indicates “a more cautious re-engagement, rather than a complete shift in risk.”
Related reading
In derivatives, the firm found little evidence of strong guiding belief. Funding rates remain broadly balanced, implied volatility has declined across the curve, and the 25-delta skew continues to favor puts over calls, even as the tilt toward more defensive extremes has softened. Simply put, traders have reduced some of their stress hedging, but they also haven’t aggressively moved to upside exposure.
Hyperliquid liquidation data reinforces the image of a reactive market. The long liquidations are between $63,000 and $65,000, while the short liquidation clusters are concentrated around $74,000 to $76,000. Recent price action has repeatedly interacted with these zones, suggesting that flows and liquidation mechanisms continue to drive bandwidth more than strong underlying belief.
Glassnode also cited dealer positioning as an important near-term market structure factor. A large pocket of negative gamma between $74,000 and $76,000 could amplify moves if the spot continues higher, turning what looks like resistance into an area where hedging flows accelerate price. Yet the report remains far from declaring an outbreak regime.
The result is a market that looks healthier than during the February crisis, but is still far from stable. Bitcoin bulls may have a clear target of $78,000, but Glassnode’s message is that regaining it will require more than just momentum. Sustained inflows, deeper institutional participation and sufficient real demand will be needed to absorb the profit-taking that is now gaining momentum.
At the time of writing, BTC was trading at $74,905.
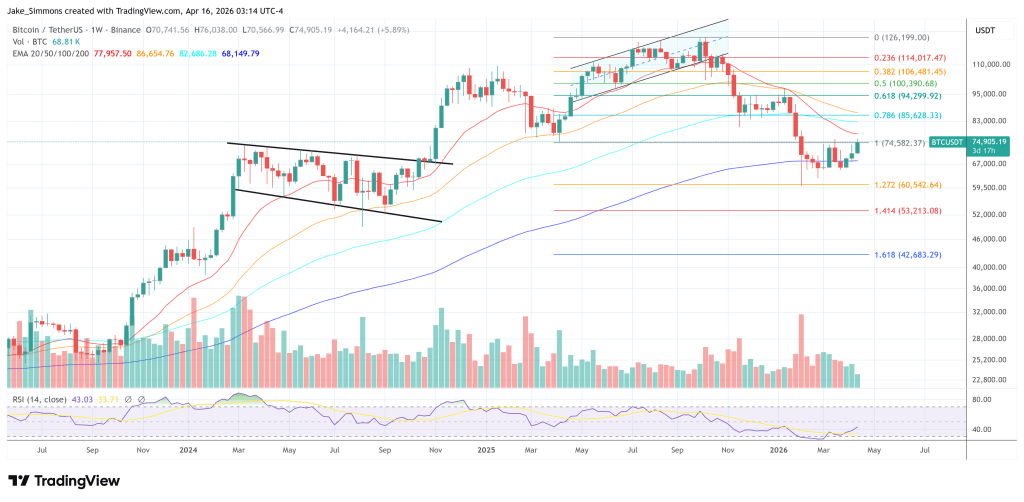
Featured image created with DALL.E, chart from TradingView.com