
 is targeting $20 after breaking the key resistance at $14")
- Aptos broke through the $14 resistance and signaled bullish momentum with $20 in sight.
- APT showed strong buyer interest as MACD and RSI confirmed growth.
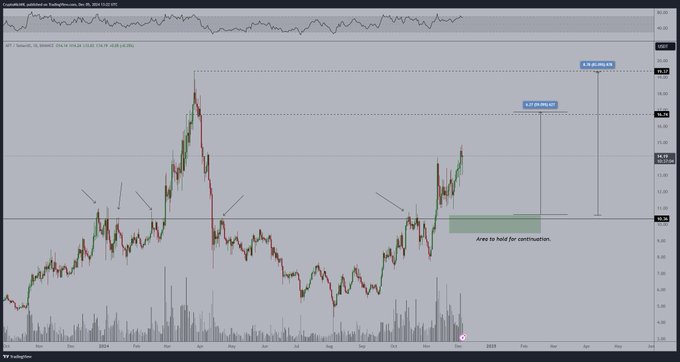
Aptus [APT] has continued its steady climb, recently crossing the $14 mark. Analyst Michaël van de Poppe suggests a bullish trend could continue, with potential upside towards $20, as long as key support levels hold.
Aptos recently broke above the $11.30-$11.50 range, a former resistance zone that now serves as a support area. This shift indicates continued bullish momentum.
Analysts suggest that a successful retest of this support would further confirm the uptrend.
Source:
Market activity shows that buyer interest has remained robust, with the breakout accompanied by strong volume. This signals confidence among market participants and is in line with the current upward trajectory.
Main resistance levels
At the time of writing, Aptos was trade at $14.24, after a price increase of 0.99% in the past 24 hours and a rise of 12.85% in the past week.
Analysts have identified two key resistance levels to watch: the first is around $13.80-$14.00, which matches a previous swing high, and the second around $17.00, a historic resistance zone.
A break above these levels could pave the way for a move towards $20. However, traders are taking potential profit-taking into account as the exchange’s inflow data shows more and more APT being deposited on trading platforms.
Technical indicators reflect strong momentum
Technical indicators suggest that APT’s uptrend has room to grow. The Relative Strength Index (RSI) stood at 64.44, indicating bullish momentum but still below overbought territory. This leaves room for assets to evolve further without immediate risk of a reversal.
The Moving Average Convergence Divergence (MACD) indicator also confirmed the positive momentum, with the MACD line sitting above the signal line and the histogram bars in green. This reflects the increasing buying pressure in the market.
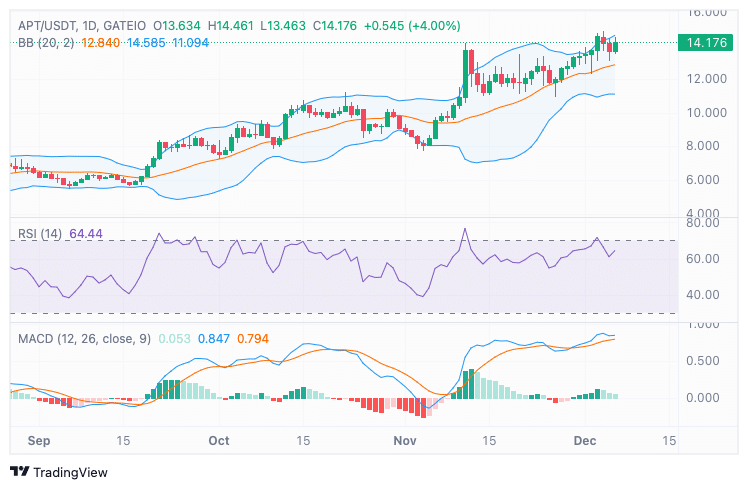
Source: TradingView
Moreover, the price tested the upper Bollinger Band, indicating strong bullish momentum. The middle band, which is around $13.00, is seen as a key support level if a pullback occurs in the near term.
Market activity and on-chain data indicate increased interest
On-chain data from Coinglass shows a mixed picture for APT. While trading volume fell 28.50% to $746.39 million, Open Interest remained stable with a slight increase of 0.08%, reflecting continued market engagement.
A net inflow of $1.49 million into exchanges indicates possible selling pressure as traders may move tokens onto exchanges to take profits.
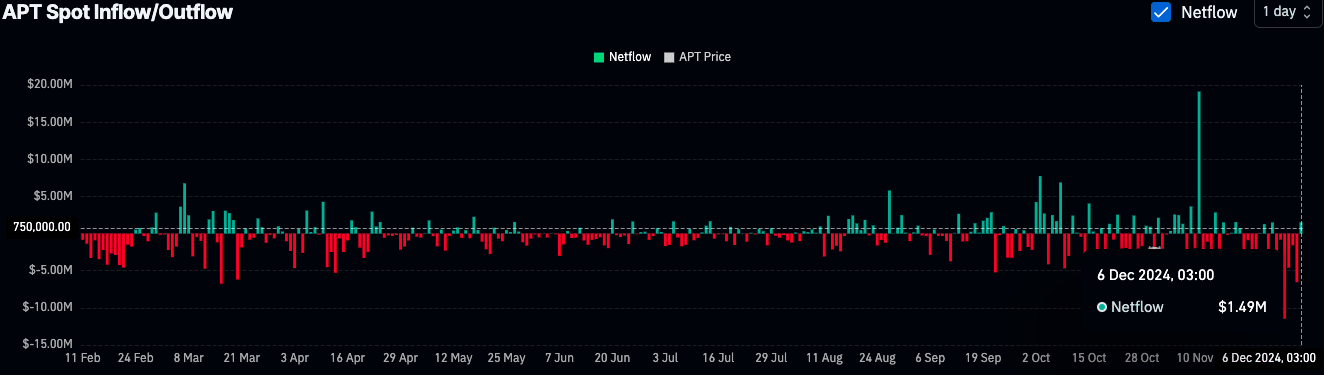
Source: Coinglass
Read Aptos’ [APT] Price forecast 2024–2025
Despite these fluctuations, the overall sentiment remains optimistic as the asset shows a clear bullish structure.
Analysts continue to watch for key retests and resistance levels as APT moves closer to its next targets.