
Crypto drops can feel brutal. One minute, the chart looks ready to recover. The next, price rolls over again and makes you question everything.
That’s where patterns help. Not because they predict the future, but because they give you structure. A double bottom can help you spot when selling pressure may be weakening, when buyers are defending support, and when a possible reversal deserves attention.
What Is a Double Bottom Pattern in Crypto?
A double bottom pattern is a bullish reversal pattern used in technical analysis and crypto trading. It usually appears after a downtrend and signals a potential shift from bearish to bullish conditions.
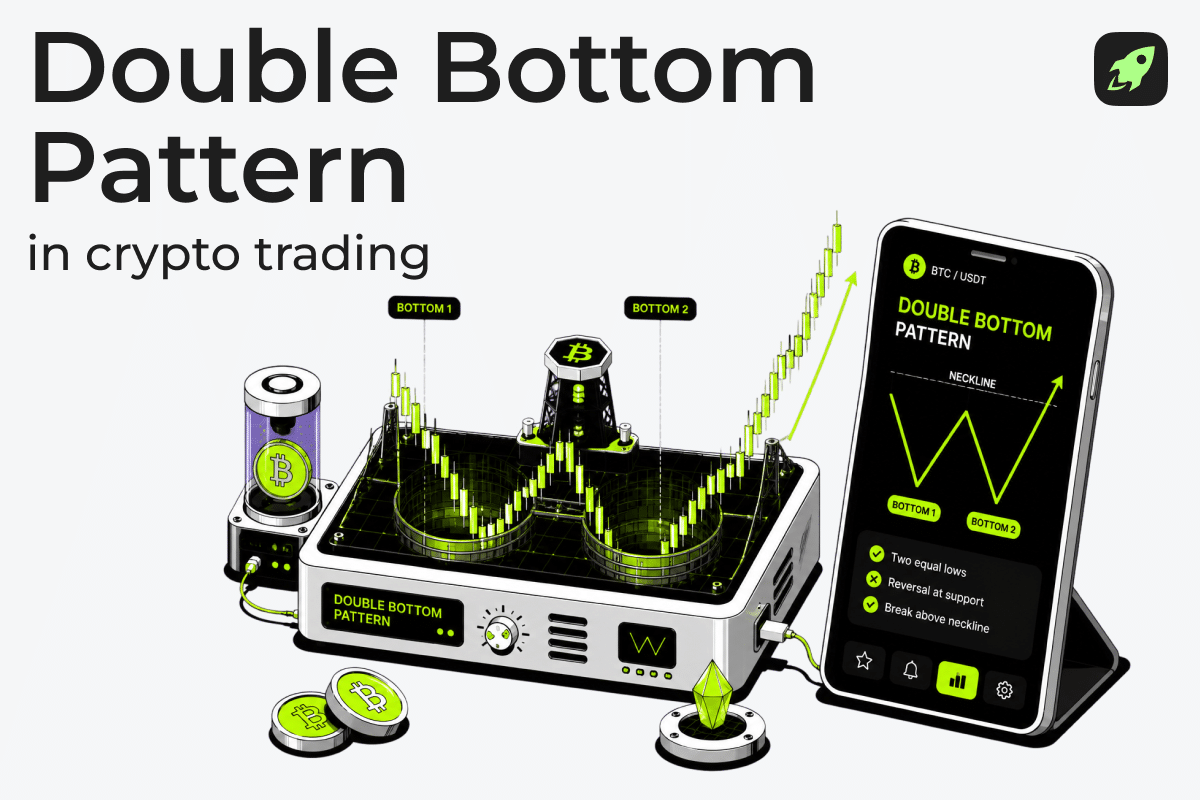
The double bottom chart pattern crypto traders watch has a clear structure: two lows near approximately the same level, with a moderate peak between them. This creates a W-shaped structure on the chart.
The pattern suggests that sellers tried twice to push price below the same support level but failed both times. That repeated defense can signal a potential bullish reversal. Still, the setup isn’t complete just because the shape appears. Most traders wait until price breaks above the neckline, which is the resistance level formed by the rebound between the two lows.
Why Traders Call It the “W Pattern”
The double bottom earns its “W pattern” nickname from its visual shape. Price drops, bounces, drops again, and then rises toward a breakout.
Because the pattern resembles a W, it’s easy to spot. But easy doesn’t mean reliable. You still need trend context, support, volume confirmation, and a clean neckline before treating the setup seriously.
The Core Anatomy of a Double Bottom Pattern
A valid double bottom has several key characteristics. Each part helps you understand whether the setup is actually forming or whether you’re only seeing random price movements.
First Bottom: The First Test of Support
The first bottom is the first major low after a downtrend. Price hits a low point, and buyers start defending that area.
At this stage, selling pressure may be slowing. But one bounce doesn’t confirm a trend reversal. The pattern begins only when the market later returns to test the same area again.
Support Level: The Price “Floor” Buyers Try to Defend
The support level is the price floor where buyers step in. In a double bottom, both lows should form near the same support zone.
They don’t need to match perfectly. In many real charts, the two lows sit close rather than identical. What matters is that price fails to break materially below the same area twice.
Interim Peak: The Bounce Between the Two Lows
After the first bottom, price bounces and forms an intermediate high. This bounce shows that buyers are trying to regain control, at least temporarily.
That intermediate high matters because it defines the neckline. Later, this level becomes the main confirmation point.
Neckline Resistance: The “Ceiling” Price Must Break
Neckline resistance is the resistance level created by the interim peak. In simple terms, it’s the ceiling price must break before the double bottom becomes meaningful.
The neckline occurs between the two lows. Once price breaks above that level and holds, many traders treat it as bullish confirmation.
Second Bottom: The Second Support Test
The second bottom forms when price falls back toward the previous support level. This is the critical retest.
If buyers defend the same area again, the validity of the pattern improves. The second bottom shows that sellers failed twice to break support, which can point to weaker bearish momentum and rising buying pressure.
Breakout: The Moment the Pattern Becomes Meaningful
The breakout is where the pattern becomes actionable. Many traders treat the double bottom as incomplete until price breaks above the neckline resistance.
A breakout doesn’t guarantee a major reversal. But it does show that price moved beyond the key resistance level created during the pattern formation.
How a Double Bottom Forms Step by Step
The double bottom pattern forms in stages. You shouldn’t rush the process because each stage tells you something different about the market.
Step 1: Price Is Already in a Downtrend
A double bottom only works as a reversal pattern if it appears after a clear downward move. Without a prior decline, the setup may just be range trading.
Context matters. A W shape inside sideways chop doesn’t carry the same meaning as a W shape after a sustained sell-off.
Step 2: Selling Pressure Creates the First Bottom
The pattern begins when selling pressure drives price lower into a support zone. Buyers enter, demand returns, and price stops falling.
This first low is only an early sign. You don’t yet know whether the market is reversing or just pausing before another leg down.
Step 3: Buyers Push Price Up to Form the Interim Peak
Next, price bounces from the first low and forms the interim peak. This move gives you the neckline reference.
The bounce also shows that buyers are testing demand. Still, the double bottom is not confirmed yet.
Step 4: Price Falls Again but Support Holds
Price then returns to the support zone. This second test matters because sellers get another chance to break the market lower.
If support holds, the structure starts to look more convincing. Price fails to break the same area twice, which can signal a potential trend reversal.
Step 5: Price Breaks Above Neckline Resistance
The setup becomes stronger when price breaks above the neckline. This is the main confirmation event.
Many traders wait for a close above the neckline rather than reacting to a quick wick. Patience can help reduce false signals and weak entries.
Step 6: The Market May Retest the Neckline
After the breakout, price may pull back and retest the neckline. When previous resistance becomes support, traders call it a support flip.
This retest isn’t required. But if price holds the neckline and bounces, it can add confidence to the setup.
Market Psychology Behind the Double Bottom
A double bottom is more than a shape. It reflects a shift in market psychology.
First Bottom: Sellers Are Still Dominant
At the first bottom, sellers still control the market. Price has stopped falling, but the broader trend remains weak.
Some buyers may step in early. Others wait because the market hasn’t shown enough strength yet.
Bounce: Buyers Begin Testing Demand
The bounce shows that buyers are willing to defend the low. But it doesn’t prove that a bullish reversal has started.
This stage creates the neckline. It also gives you the first sign that bearish momentum may be losing force.
Second Bottom: Sellers Fail to Break Support Again
The second bottom is where the setup becomes interesting. Sellers try to push price lower again, but support holds.
This repeated failure can change sentiment. Buyers gain confidence, while sellers may start closing short positions.
Breakout: Buyers Push Through the Ceiling
When price breaks above the neckline, buyers take control at a key decision point. That move signals a potential shift in market momentum.
High volume during the breakout can make the signal stronger because it shows broader participation.
How to Identify a Valid Double Bottom in Crypto
Not every W shape is a double bottom. To detect patterns more accurately, look for structure, confirmation, and market context.
1. There Should Be a Clear Prior Downtrend
A double bottom pattern occurs after a downtrend. Without that prior weakness, the structure may only reflect sideways price action. The pattern’s reversal context is what gives it meaning.
2. The Two Lows Should Form Near the Same Support Zone
The two lows should sit near the same price level. Some traders prefer the lows to fall within a tight range, such as 1–3%, but crypto volatility can make exact rules less useful. Focus on the support zone. If one low is far below the other, the setup may be weaker.
3. The Neckline Should Be Easy to Draw
A strong setup has a clear neckline. If you can’t identify the intermediate high easily, the breakout level may be too messy. A clean neckline helps you define entry points, exit points, and invalidation.
4. The Breakout Should Happen Above the Neckline
The visual shape alone isn’t enough. A double bottom becomes more meaningful when price breaks above the neckline. This breakout turns the structure from a possible reversal into a confirmed setup for many traders.
5. Volume Should Support the Move
Volume analysis helps you judge the strength of the breakout. Increasing volume suggests that more market participants support the move. A low-volume breakout can still work, but it has a higher risk of failure.
Confirmation Signals: When Does a Double Bottom Actually Count?
Confirmation separates a possible setup from a usable trade idea.
Neckline Breakout Confirmation
The neckline breakout is the main confirmation signal. When price moves above the neckline, it shows that buyers have cleared the key resistance level. For many traders, this creates the long entry signal.
Candle Close vs. Temporary Wick
A brief wick above the neckline can fail quickly. That’s why many traders wait for a candle close above resistance. A close doesn’t remove risk, but it can reduce the chance of chasing a fake move.
Increased Trading Volume
High volume can strengthen breakout confirmation. It suggests that the move isn’t just a thin-liquidity spike. In crypto markets, this matters because sudden wicks and false breakouts are common.
Retest Confirmation
Some traders wait for price to break the neckline, return to it, and hold it as support. This can create a more conservative entry. The trade-off is simple: you may get a cleaner setup, but you may also miss part of the move.
Momentum Indicators as Extra Confirmation
Technical indicators such as RSI, MACD, MFI, and moving averages can support your reading of the chart. They’re not required parts of the double bottom pattern. They’re filters that help you judge momentum, potential reversal strength, and bullish divergence.

How to Get Free Crypto
Simple tricks to build a profitable portfolio at zero cost

Double Bottom Trading Strategy: From Pattern to Plan
The double bottom chart pattern gives you a structure. It doesn’t give you certainty.
Entry Point: Common Ways Traders Enter
Traders usually use one of three entry styles:
- Enter near the second bottom for an aggressive setup before confirmation.
- Enter when price breaks above the neckline.
- Enter after a neckline retest holds as support.
Each method has a different risk profile. Early entries can offer better reward, but they also carry higher risk.
Long Position: Why Traders Look for Upside After Confirmation
A double bottom is a bullish reversal setup, so traders often use it to plan a long position after confirmation.
The logic is simple. If sellers fail twice at support and buyers push price through resistance, the market may be shifting toward bullish momentum.
Price Target: Using the Pattern Height
A common price target method uses pattern height. Measure the distance from the support level to the neckline, then project the same distance upward from the breakout point.
For example, if support is at $1.00 and the neckline is at $1.20, the pattern height is $0.20. If price breaks above $1.20, the projected profit target is $1.40.
This is only an estimate. A profit target helps you plan, but it doesn’t guarantee the price reversal will continue.
Stop-Loss Order: Planning for Invalidation
Risk management matters more than the pattern itself. Many traders place a stop-loss below the second bottom or below the support zone.
Others place it below the neckline after a successful retest. The goal is to minimize risk and define where the setup no longer works.
Risk/Reward: Why the Setup Must Make Sense Before Entry
Even a valid double bottom may not be worth trading if the downside is too large.
Before opening a long position, compare the possible profit target with the stop-loss distance. If you’re unsure how the risks involved fit your situation, seek independent financial advice.

Practical Example: Reading a Double Bottom on a Crypto Chart
Let’s use a simple hypothetical example. The numbers below aren’t real market data.
Example Setup: A Crypto Asset After a Sell-Off
Imagine a crypto asset falls from $1.60 to $1.00 after a sharp sell-off. The $1.00 area becomes the first major support level. This could be BTC, ETH, or any altcoin or currency pair. The logic is the same across crypto trading.
Marking the First Bottom and Support Level
The first bottom forms at $1.00. Price bounces from that area, which tells you buyers are defending the level. For now, it’s only a bounce. You don’t have a confirmed double bottom yet.
Drawing the Neckline From the Interim Peak
Price bounces from $1.00 to $1.20. That $1.20 level is the intermediate high and becomes the neckline resistance. This is now the level to watch.
Waiting for the Second Bottom
Price falls again and returns near $1.00. If it holds that area, the second bottom forms. This second test is the key. It shows that sellers couldn’t break the same support twice.
Confirming the Breakout With Volume
If price then breaks above $1.20 with high volume, the double bottom looks stronger. If volume is weak, the setup may still work, but the risk of false breakouts rises.
Planning Entry, Target, and Stop-Loss
A breakout entry could happen above $1.20. The measured price target would be $1.40 because the pattern height is $0.20. A stop-loss could sit below the second bottom, such as under $1.00. That gives you a clear plan for entry, profit target, and invalidation.
What Invalidates a Double Bottom Pattern?
A double bottom can fail. The most common warning sign is a failed breakout, where price briefly moves above the neckline and then falls back below it. The setup becomes weaker if price loses the neckline after breakout. It’s usually invalidated if price falls decisively below the second bottom or the main support level. At that point, the bullish confirmation no longer holds.

Crypto-Specific Factors That Can Change the Setup
Crypto markets are volatile, always open, and highly sensitive to news. That can make chart patterns behave differently than they do in slower markets.
1. 24/7 Trading and Timeframe Selection
Double bottoms can form on 1H, 4H, daily, or weekly charts. Shorter timeframes often produce more noise and more false signals. Long-term charts usually carry more weight because they filter out smaller price movements. Still, they also take more time to develop.
2. Liquidity and Exchange-Specific Wicks
Thin liquidity can create exaggerated wicks. A low may appear on one exchange but not another. That’s why it helps to compare charts across platforms before trusting a single low point.
3. Bitcoin Dominance and Broader Market Sentiment
Altcoin chart patterns don’t exist in isolation. If the bitcoin price weakens sharply, even a strong-looking altcoin double bottom can fail. Broader market conditions and market trends matter. Crypto often moves together when risk appetite changes.
4. News, Token Unlocks, ETF Flows, and Macro Events
News can overpower technical analysis. Token unlocks, ETF flows, regulatory updates, and macro events can all move crypto markets quickly. A clean setup can break down if the broader market reacts hard to new information.
5. Leverage and Liquidation Cascades
Leverage can turn small moves into sharp breakouts or breakdowns. Liquidation cascades can also create sudden spikes that look like confirmation. This is one reason false breakouts are common in crypto.
Double Bottom vs. Similar Chart Patterns
The double bottom can resemble other chart formations. Knowing the difference helps you avoid weak setups and other chart patterns that only look similar.
Double Bottom vs. Double Top
A double bottom is a W-shaped bullish reversal. A double top is an M-shaped bearish reversal.
The double top pattern forms after an uptrend and has two peaks near resistance. It confirms when price breaks below the support area between those two peaks. The double bottom does the opposite: it forms after a downtrend and confirms when price breaks above the neckline.
Double Bottom vs. Triple Bottom
A triple bottom has three support tests instead of two. Both patterns can signal market reversals when confirmed.
The triple bottom usually takes longer to form. It may show stronger support because buyers defended the same area three times.
Double Bottom vs. Inverse Head and Shoulders
A double bottom has two similar lows. An inverse head and shoulders has three troughs, with the middle trough lower than the other two.
Both can signal a bullish reversal, but the structures are different.
Double Bottom vs. Range Trading
A range can produce W-shaped moves without a real trend reversal. If price is simply bouncing between support and resistance, the setup may not show a major reversal.
Look for prior trend context, confirmation, and volume before trusting the pattern.
Read more: What Is Range Trading?
Double Bottom vs. Dead-Cat Bounce
A dead-cat bounce is a short rebound after a sharp decline. It often fails and makes new lows.
A double bottom needs two support tests and a breakout above the neckline. One bounce isn’t enough.
Common Mistakes Beginners Make
The pattern is simple to see, but easy to misuse.
Calling Every W Shape a Double Bottom
A W shape alone doesn’t confirm anything. You need a prior downtrend, two lows near support, a clear neckline, and confirmation.
Without those elements, the setup may only be noise.
Buying Before Neckline Confirmation
Buying at the second bottom can offer more upside, but it also means entering before confirmation.
Beginners often assume the second bottom is automatically the entry point. That can lead to losses if price breaks support instead.
Ignoring Volume
Volume confirmation matters because it shows whether buyers are actually participating.
If price breaks the neckline on weak volume, the breakout may lack conviction.
Forgetting the Broader Crypto Trend
A good setup on one chart can fail if the wider market turns bearish.
Always check Bitcoin, sector momentum, liquidity, and major news before relying on one pattern.
Using No Stop-Loss
A stop-loss protects you when the setup fails. Without one, a failed breakout can turn into a much larger loss.
Plan the risk before the trade, not after price moves against you.
Treating the Price Target as Guaranteed
A measured target is a planning tool, not a promise.
Price may stall before reaching the target, especially in volatile or weak market conditions. Take the target seriously, but don’t treat it as certain.
Final Thoughts
The double bottom pattern can help you spot potential trend reversals after a sell-off. It gives you a clear structure: support, neckline, breakout, target, and invalidation.
But no pattern is a shortcut. Wait for confirmation, check volume, respect broader crypto conditions, and manage risk before entering. The setup works best when it becomes part of a plan—not a reason to guess the bottom.
FAQ
Is a double bottom bullish or bearish?
A double bottom is generally bullish. It forms after a downtrend and signals a potential bullish reversal once price breaks above the neckline.
Is a double bottom pattern reliable?
It can be useful, but it’s not guaranteed. The setup is stronger when it has a clear prior downtrend, two lows near support, a neckline breakout, and strong volume.
What confirms a double bottom?
A double bottom is confirmed when price breaks above the neckline resistance. A candle close and increased volume can make that confirmation stronger.
Does the second bottom need to be exactly the same price as the first?
No, the second bottom only needs to form near the same support zone. Perfect symmetry isn’t required.
Is volume required for a double bottom?
Volume isn’t part of the basic shape, but it’s important for confirmation. High volume on the breakout shows stronger buyer participation.
What invalidates a double bottom?
A failed breakout can weaken the setup. A decisive move below the second bottom or support level usually invalidates it.
Can a double bottom form on any crypto timeframe?
Yes, a double bottom can form on short-term or long-term charts, but higher timeframes usually carry more weight and produce fewer false signals.
Should beginners trade double bottom patterns?
Beginners can study them, but they should focus on confirmation, stop-loss placement, and risk management first. The pattern is useful only when it’s traded with discipline.
What is the difference between a double bottom and a double top?
A double bottom is a W-shaped bullish reversal after a downtrend. A double top is an M-shaped bearish reversal after an uptrend, built around two peaks and a breakdown below support.
Disclaimer: Please note that the contents of this article are not financial or investing advice. The information provided in this article is the author’s opinion only and should not be considered as offering trading or investing recommendations. We do not make any warranties about the completeness, reliability and accuracy of this information. The cryptocurrency market suffers from high volatility and occasional arbitrary movements. Any investor, trader, or regular crypto users should research multiple viewpoints and be familiar with all local regulations before committing to an investment.