

XRP is pushing back against what analyst EGRAG CRYPTO describes as a crucial resistance band, with a new chart claiming the token is entering a decisive technical phase. In the analyst’s framework, the immediate question is whether an ascending triangle forming below “Zone 1” could trigger the next higher part and whether that move could ultimately reopen the path to previous cycle highs.
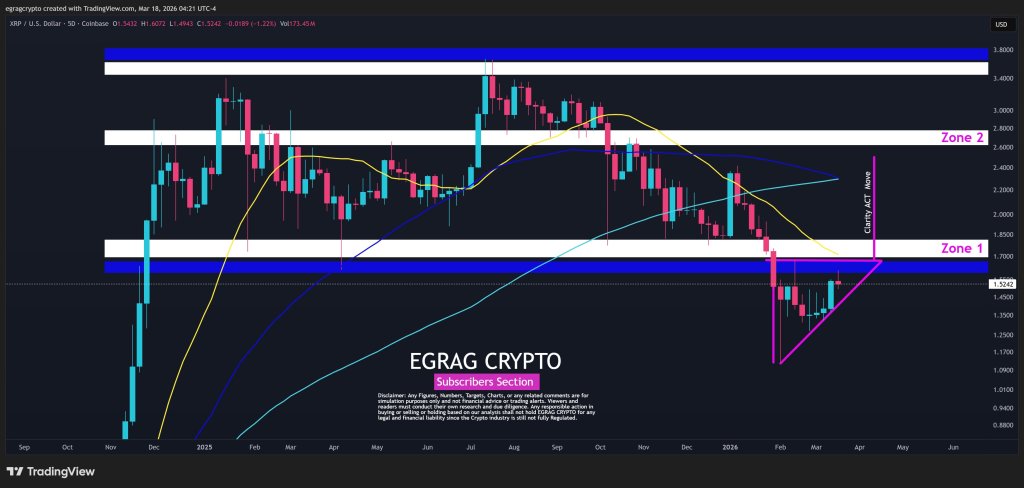
In one after on The five-day XRP/USD chart shows the price falling below a blue resistance area around $1.65 to $1.70, while a rising lower trendline indicates that buyers have continued to enter dips.
The core of the thesis is simple. According to EGRAG, “The chart says this: An ascending triangle is forming below zone 1 ($1.65-$1.70). Higher lows = buyers are getting in. Resistance flat = liquidity is above. This is classic breakout fuel.”
XRP’s possible path to the ATH
That interpretation is based on a known dynamic in the market structure. An ascending triangle typically reflects repeated buying interest at increasingly higher levels, even as sellers continue to defend a fixed ceiling. According to EGRAG, that ceiling is Zone 1, and the tension area below it creates the pressure.
Related reading
EGRAG does not present the pattern as a guaranteed breakout. Instead, the message assigns explicit probabilities to both paths. “Breakout above zone 1: ~65%. Structure supports continuation. Momentum building with compression,” the analyst wrote. “Rejection/Fakeout: ~35%. If no catalyst → liquidity test first. If the Clarity Act is delayed, rejection becomes the likely scenario.”
Notably, the post repeatedly points to the Clarity Act as the narrative catalyst that could “unlock” a breakthrough above Zone 1. In other words, the triangle can store pressure, but the release still depends on a macro or policy trigger strong enough to force the price through the overhead supply.
Related reading
Even then, EGRAG argues that clearing Zone 1 would only be the first step. The post asks what it would take for XRP to reach ‘Zone 2’, marked at around $2.60 and higher on the chart. The answer is more demanding than a single breakout candle.
“Breaking Zone 1 is NOT enough,” EGRAG wrote. “To break Zone 2 ($2.60+) we need institutional flows/ETF-like exposure, BTC stability or a decline in dominance, [and] sustained weekly closes above $1.85-$2.00.”
For now, the analyst’s summary is more measured than euphoric: “Triangle = pressure. Zone 1 = trigger. Zone 2 = expansion. Catalyst starts the move…..Liquidity finishes it.”
That leaves XRP at a crossroads. If buyers can turn the current compression into a clean move by Zone 1, the conversation will quickly shift from pattern recognition to expansion targets. If not, EGRAG’s own framework suggests the market could reduce liquidity first, especially if the Clarity Act doesn’t pass in time.
At the time of writing, XRP was trading at $1.44.
Featured image created with DALL.E, chart from TradingView.com