

Ethereum price started a recovery wave above the $2,050 zone. ETH is now showing positive signs and could aim for more gains above $2,150.
- Ethereum started a recovery wave above the $2,050 zone.
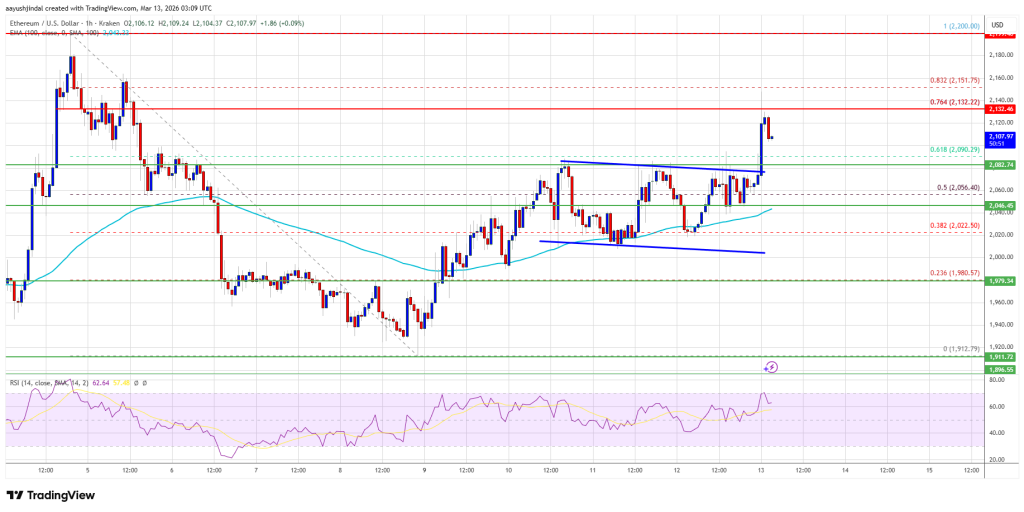
- The price is trading above $2,050 and the 100-hourly Simple Moving Average.
- There was a break above a descending channel with resistance at $2,080 on the hourly chart of ETH/USD (data feed via Kraken).
- The pair could start a new decline if it stays below the $2,150 zone.
Ethereum price clears resistance
Ethereum price extended its recovery wave after reaching the $1,980 zone, just like Bitcoin. ETH price was able to break the USD 2,020 resistance zone.
The bulls pushed the price above the 61.8% Fib retracement level of the downward move from the $2,200 swing high to the $1,912 low. Additionally, there was a break above a descending channel with resistance at $2,080 on the hourly chart of ETH/USD.
Finally, the price tested the 76.4% Fib retracement level of the downward move from the $2,200 swing high to the $1,912 low. Ethereum price is now trading above $2,080 and the 100-hourly Simple Moving Average.
If the bulls continue to act above $2,050, the price could rise again. Immediate resistance is seen around the $2,135 level. The first major resistance is around the $2,150 level. The next major resistance is near the $2,220 level. A clear move above the USD 2,220 resistance could send the price towards the USD 2,250 resistance. An upside break above the $2,250 region could call for more gains in the coming days. In the mentioned case, Ether could rise towards the USD 2,320 or even USD 2,340 resistance zone in the short term.
Another drop in ETH?
If Ethereum fails to clear the USD 2,135 resistance, it could trigger another decline. The initial downside support is near the $2,080 level. The first major support is near the $2,050 zone.
A clear move below the USD 2,050 support could push the price towards the USD 2,000 support. Any further losses could send the price towards $1,950. The main support could be at USD 1,920.
Technical indicators
hourly MACD – The MACD for ETH/USD is gaining strength in the bullish zone.
RSI per hour – The RSI for ETH/USD is now above the 50 zone.
Major support level – $2,050
Major resistance level – $2,150