- Bitcoin’s post-halving historical cycles suggested a potential top between June and October 2025, with forecasts approaching $200,000.
- Technical indicators such as MACD and Bollinger Bands showed bullish signals, but traders should remain cautious of possible reversals.
Bitcoin [BTC] closed above $64,000 on Monday after a week of upward momentum, driven by encouraging signals from the US Federal Reserve.
Investors responded positively to comments from Fed Chairman Jerome Powell, who confirmed plans for a rate cut in September.
This boosted sentiment in both traditional markets and the crypto space.
The recent rally helped Bitcoin recover some losses from previous weeks, although it still saw a slight decline of 1.40% over the past 24 hours.
Despite this, Bitcoin continued to rise 3.15% over the past seven days, with a market cap of approximately $1.23 trillion per month. Coingecko.
Historical patterns after the halving
Bitcoin traders and analysts have been keeping a close eye on Bitcoin’s price performance following the most recent halving.
Previous cycles have shown a pattern where Bitcoin’s price peaks a few months after each halving.
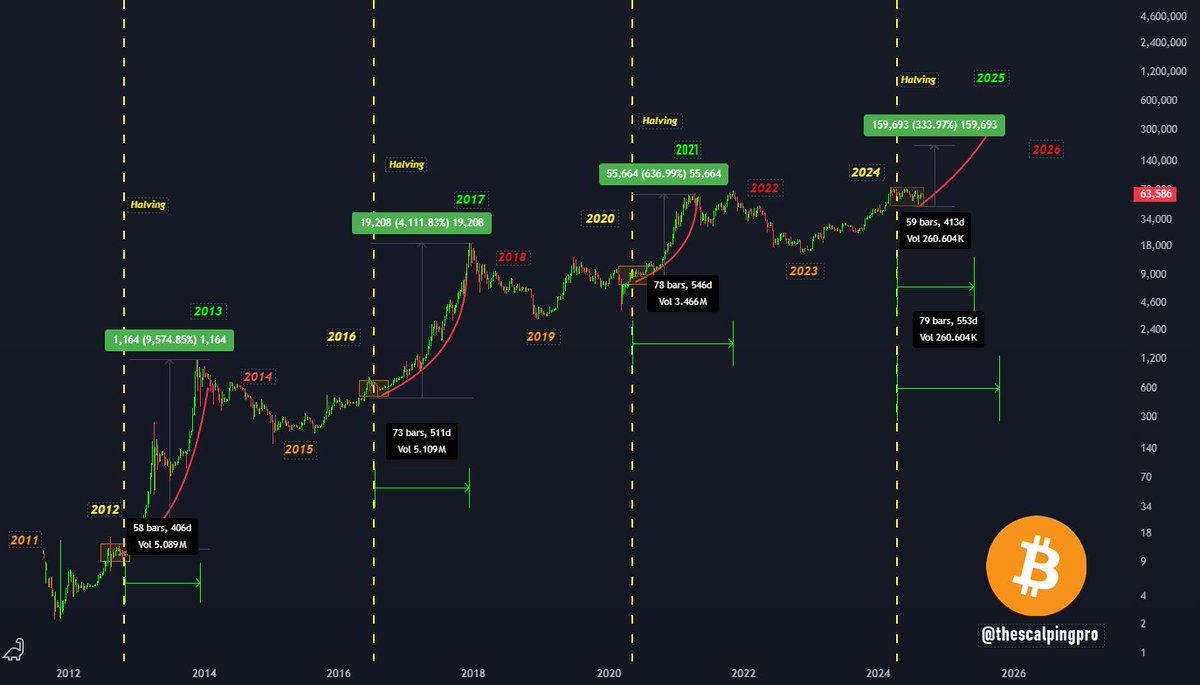
For example, after the 2013 halving, Bitcoin rose more than 9,500%, reaching its peak 406 days later. The 2017 cycle saw a 4,100% increase, peaking 511 days after the halving.
In 2021, Bitcoin rose 636% before reaching its peak 546 days after the halving.
According to crypto trader StockroomThis cycle could follow a similar trajectory, with the next peak expected between June and October 2025.
The projection is based on historical data, which indicates that Bitcoin could reach a top in 400 to 550 days.
Even with more moderate growth, such as a 300% increase, the cryptocurrency could approach the $200,000 mark within this period.


Source:
Bullish momentum ahead?
Technical indicators suggest that Bitcoin could continue its uptrend in the short term.
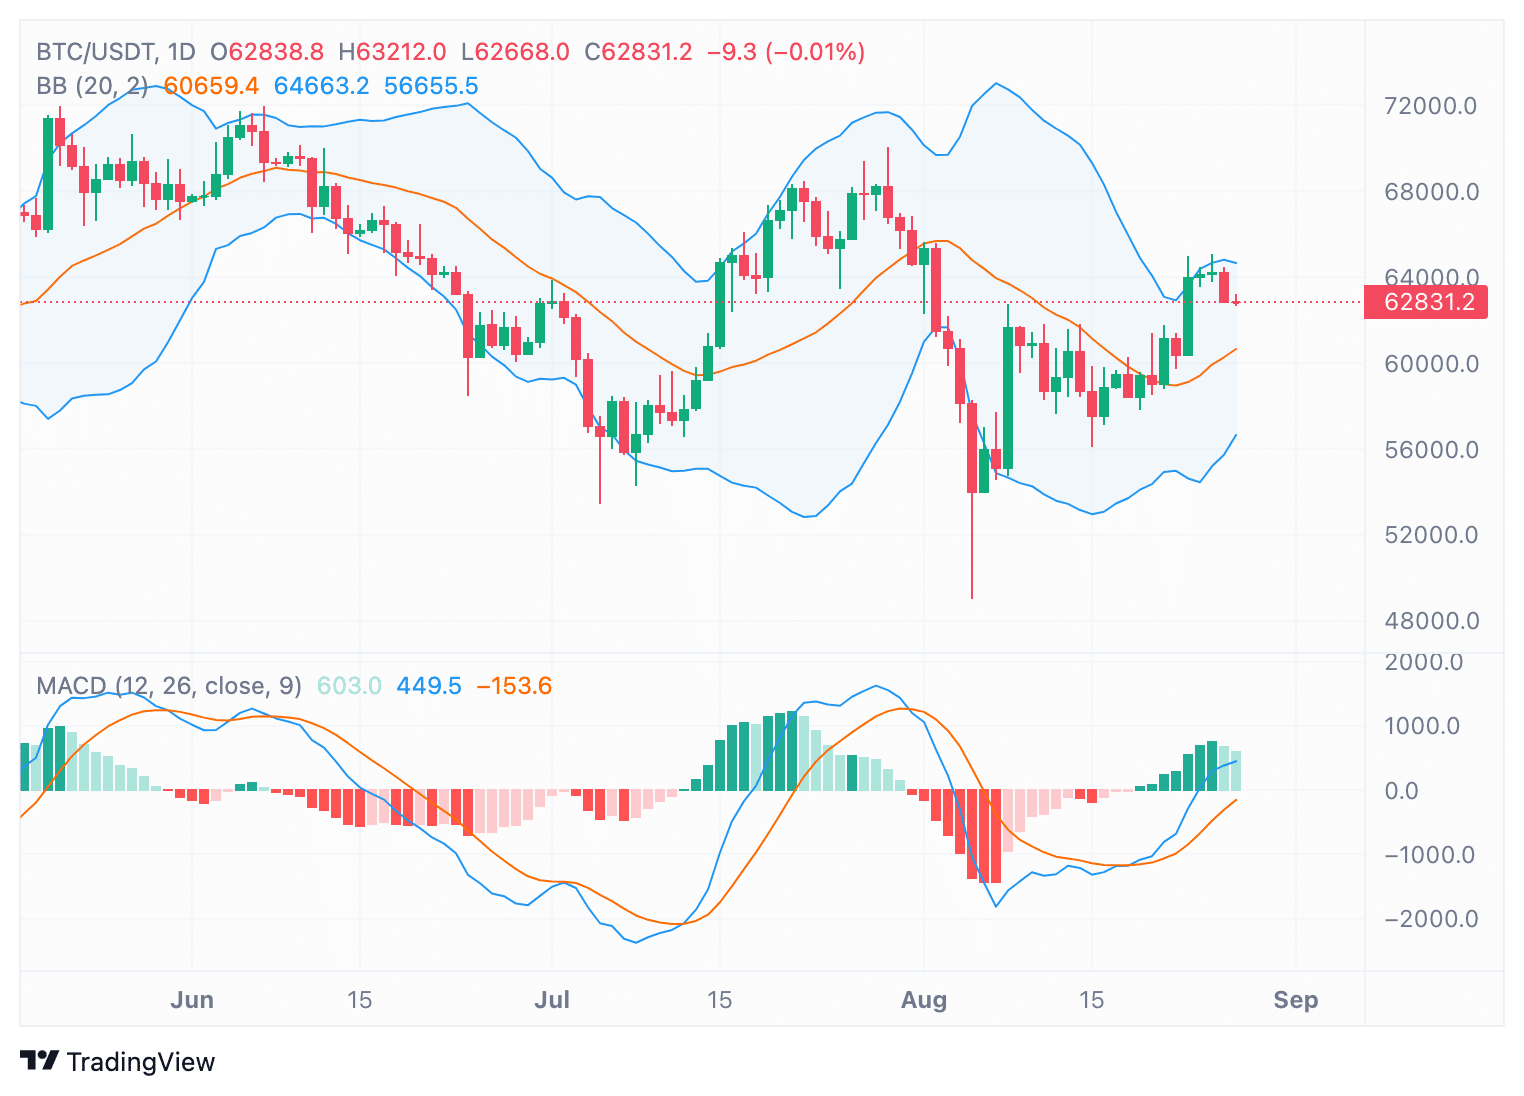
The Bollinger Bands revealed that Bitcoin’s price moved towards the upper band, indicating potential overbought conditions around the $63,000 level.
The Moving Average Convergence Divergence (MACD) has recently crossed bullish, with the MACD line rising above the signal line.
This suggested that the upward momentum could continue, as confirmed by the histogram turning green.

Source: TradingView
However, traders should be cautious as a reversal is still possible if bullish momentum weakens in the coming days.
Market sentiment remains optimistic
Bitcoin market sentiment seemed mostly positive, supported by on-chain data and exchange signals.
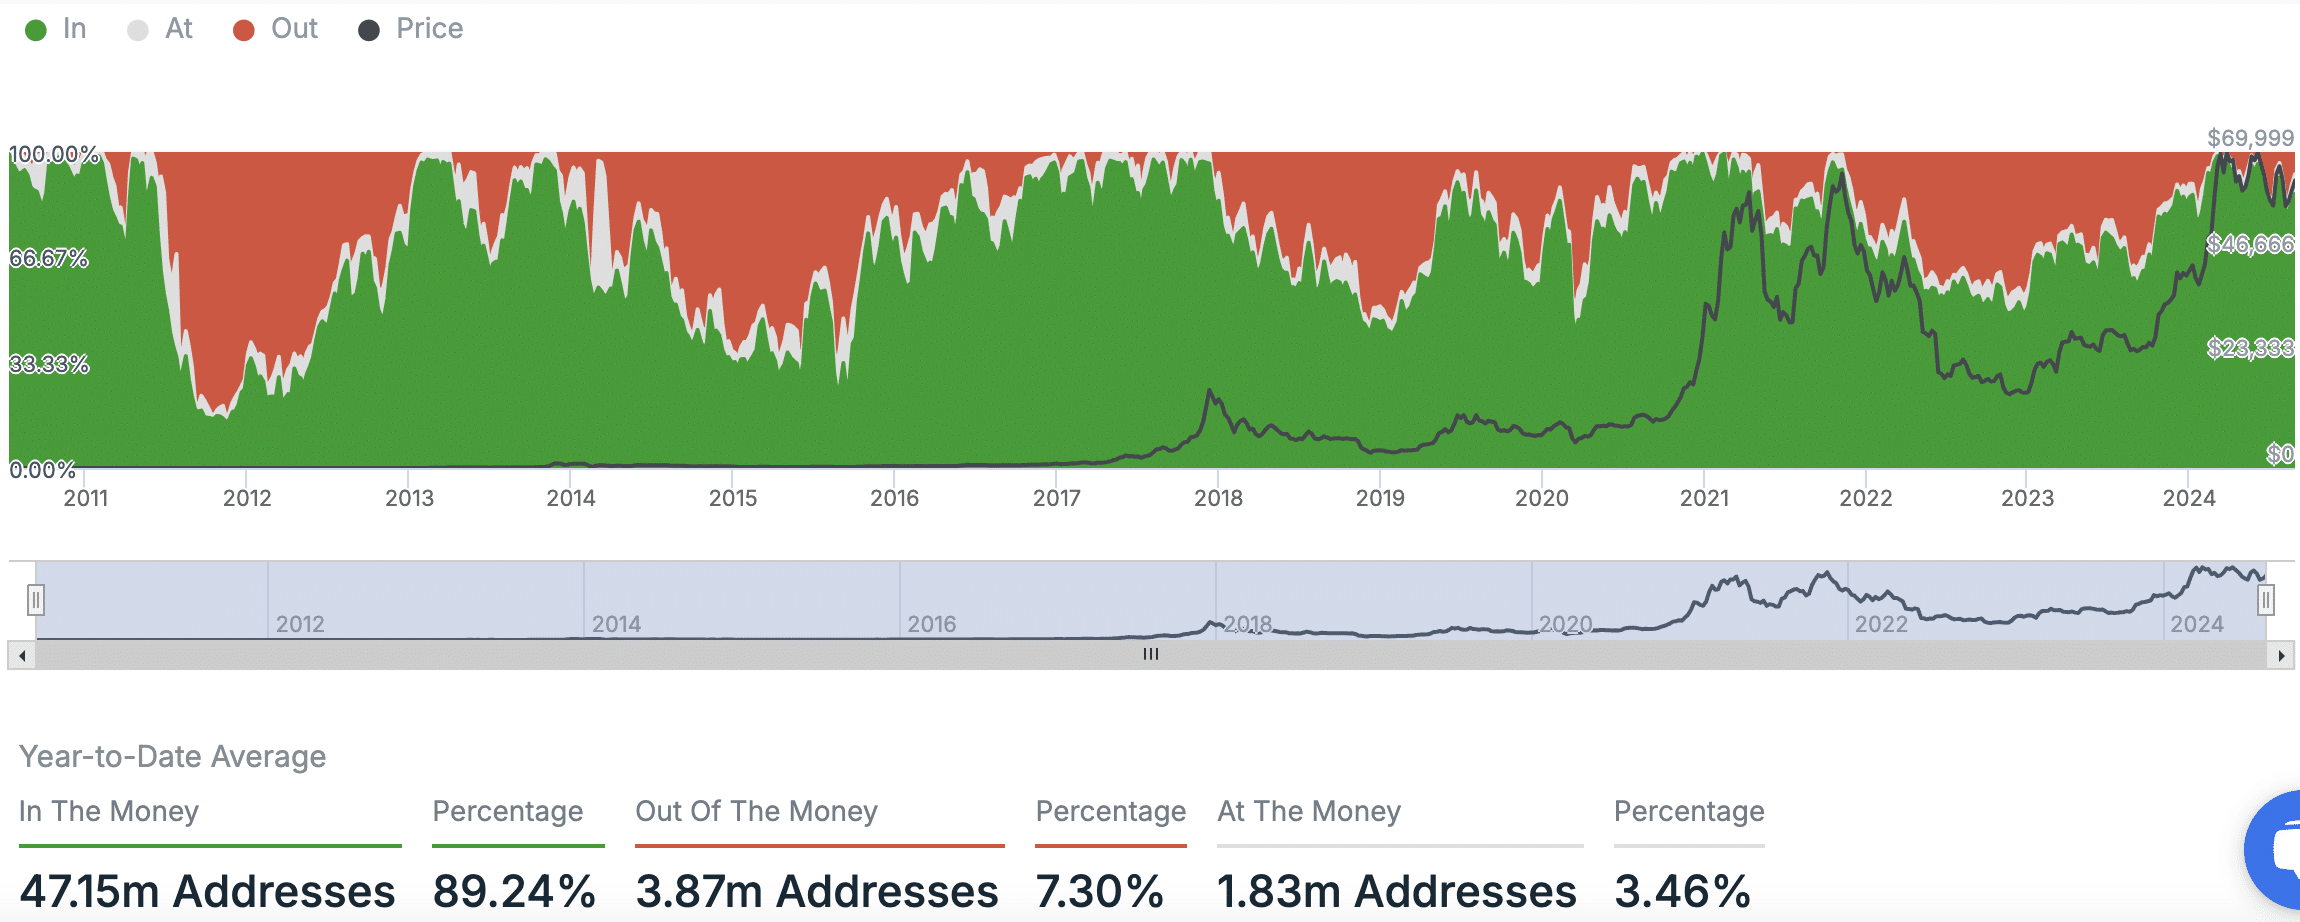
Press time data showed that 89.24% of Bitcoin addresses are “In the Money,” meaning the majority of holders made a profit.
Only 7.30% of addresses are ‘Out of the Money’, reflecting an overall profitable position for Bitcoin investors.

Source: IntoTheBlock
Read Bitcoin’s [BTC] Price forecast 2024–2025
The overall market showed a “Mostly Bullish” outlook, with three bullish indicators and four neutral indicators.
However, the futures market remained neutral, indicating that while optimism was high, traders were taking a cautious approach as they await further developments.

