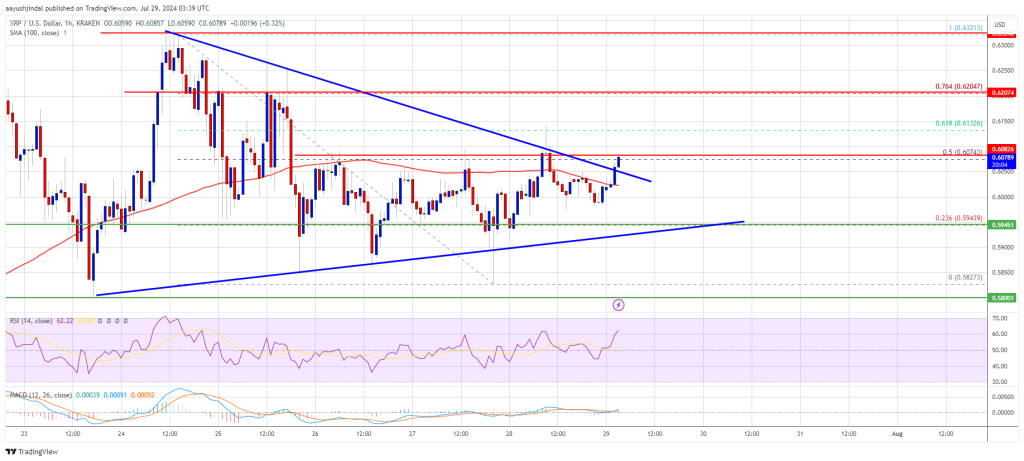
The XRP price is attempting a new rise above the $0.600 zone. The price could gain bullish momentum if it overcomes the USD 0.6200 resistance level.
- XRP price is showing positive signals from the USD 0.600 support zone.
- The price is now trading above USD 0.6050 and the 100-hourly Simple Moving Average.
- There was a break above a key contracting triangle with resistance at $0.6050 on the hourly chart of the XRP/USD pair (Kraken data source).
- The pair could gain bullish momentum if it remains above the $0.5940 support zone.
XRP price eyes could gain pace towards USD 0.650
XRP price held steady above the $0.5920 support zone. A base was formed and the price recently started an upward move above $0.600. There was a clear move above the $0.6020 resistance zone, but like Bitcoin and Ethereum, it lagged the momentum.
There was a break above a key contracting triangle with resistance at $0.6050 on the hourly chart of the XRP/USD pair. The pair is now testing the 50% Fib retracement level of the downward move from the $0.6321 swing high to the $0.5827 low.
It is now trading above USD 0.6050 and the 100-hourly Simple Moving Average. If there are more upsides, the price may encounter resistance near the $0.6135 level. The first major resistance is near the $0.6200 level or the 76.4% Fib retracement level of the downward move from the $0.6321 swing high to the $0.5827 low.

The next major resistance could be $0.6320. A clear move above the resistance at $0.6320 could send the price towards the resistance at $0.6465. The next major resistance is near the $0.6500 level. Any further gains could send the price towards the USD 0.6750 resistance.
Another withdrawal?
If XRP fails to break the USD 0.6200 resistance zone, it could trigger another decline. The initial downside support is near the $0.600 level. The next major support is at $0.5940 and in the trendline zone of the triangle.
If there is a downside break and a close below the $0.5940 level, the price could continue falling towards the $0.5820 support in the near term. The next major support is at $0.5750.
Technical indicators
Hourly MACD – The MACD for XRP/USD is now gaining speed in the bullish zone.
Hourly RSI (Relative Strength Index) – The RSI for XRP/USD is now close to the 50 level.
Major support levels – USD 0.6000 and USD 0.5940.
Major resistance levels – $0.6075 and $0.6200.

