

XRP price fell sharply against the USD 0.5250 resistance zone. It tested the USD 0.4540 support zone and is now trying to recover above USD 0.4880.
- XRP is correcting losses above the USD 0.4820 and USD 0.4840 levels.
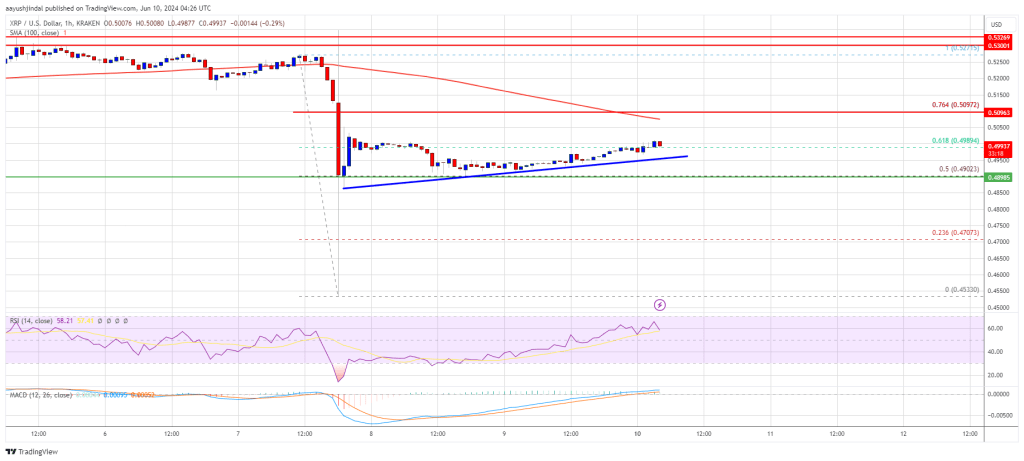
- The price is now trading below $0.5050 and the 100-hourly Simple Moving Average.
- A connecting bullish trendline is forming with support at $0.4950 on the hourly chart of the XRP/USD pair (Kraken data source).
- The pair could fall again if it remains below the $0.5050 resistance zone.
XRP price is hit
The XRP price, like Ethereum, started a major decline and fell below the $0.50 support. The price even spiked below the $0.4650 support zone. A low was formed at $0.4533 and the price is now correcting losses.
There was a move above the USD 0.470 and USD 0.4750 resistance levels. The price climbed above the 50% Fib retracement level of the downward move from the $0.5271 swing high to the $0.4533 low. A connecting bullish trendline is also forming with support at $0.4950 on the hourly chart of the XRP/USD pair.
The pair is slowly moving above the 61.8% Fib retracement level of the downward move from the $0.5271 swing high to the $0.4533 low. However, it is still trading below $0.5050 and the 100-hourly Simple Moving Average.
On the upside, the price is facing resistance around the $0.500 level. The first major resistance is near $0.5050. The next major resistance is near the $0.5120 level. A close above the USD 0.5120 resistance zone could send the price higher. The next major resistance is near USD 0.5250.
If there is a close above the USD 0.5250 resistance level, there could be a steady rise towards the USD 0.5320 resistance. Any further gains could send the price towards the USD 0.550 resistance.
Another drop?
If XRP fails to break the USD 0.5050 resistance zone, it could trigger another decline. The initial downside support is near the $0.4950 level and the trendline.
The next major support is at USD 0.4900. If there is a downside break and a close below the USD 0.490 level, the price could accelerate lower. In the said case, the price could fall and retest the $0.4740 support in the near term.
Technical indicators
Hourly MACD – The MACD for XRP/USD is now losing pace in the bearish zone.
Hourly RSI (Relative Strength Index) – The RSI for XRP/USD is now above the 50 level.
Major support levels – USD 0.4950 and USD 0.4900.
Major resistance levels – $0.500 and $0.5050.