

XRP has struggled to create some upward traction in recent days, with the price settling above $2.15 mid-week and now heading back to remains just above the $2 level.
A new long-term technical comparison shared by crypto analyst ChartNerd puts XRP’s price behavior since July’s all-time high of $3.65 in an interesting context, implying that what XRP is doing now resembles a phase from the 2016 market cycle that points to a coming massive rally.
Related reading
Repeat of the 2016 rejection and the ABC crash structure
According to crypto analyst ChartNerd: The current structure of XRP matches a similar price action that occurred in late 2016, when price rejected an accumulation supply block and entered an ABC corrective move. That correction ultimately produced a 69% flash-wick decline that extended into the first quarter of 2017.
The drop was severe and lasted for several months, eventually sending XRP down to $0.00240, but ultimately it marked the end of the correction rather than the end of the bullish cycle.
The diagram accompanying the analysis, shown below, highlights a a similar rejection pattern is now forming. This pattern is based on how the XRP price reached its most recent all-time high in July. Since then, the monthly price chart has been printing consecutive red candles, with monthly closes consistently below the opens.
At the time of writing, XRP is on a roughly 44% correction from this all-time high. This means that a correction of 69% in its entirety still needs to take place. Therefore, if history repeats itself, a full ABC-style move of 69% from its all-time high would take XRP back below $1 and as low as $0.8. This step is expected to take place in the first quarter of 2026.
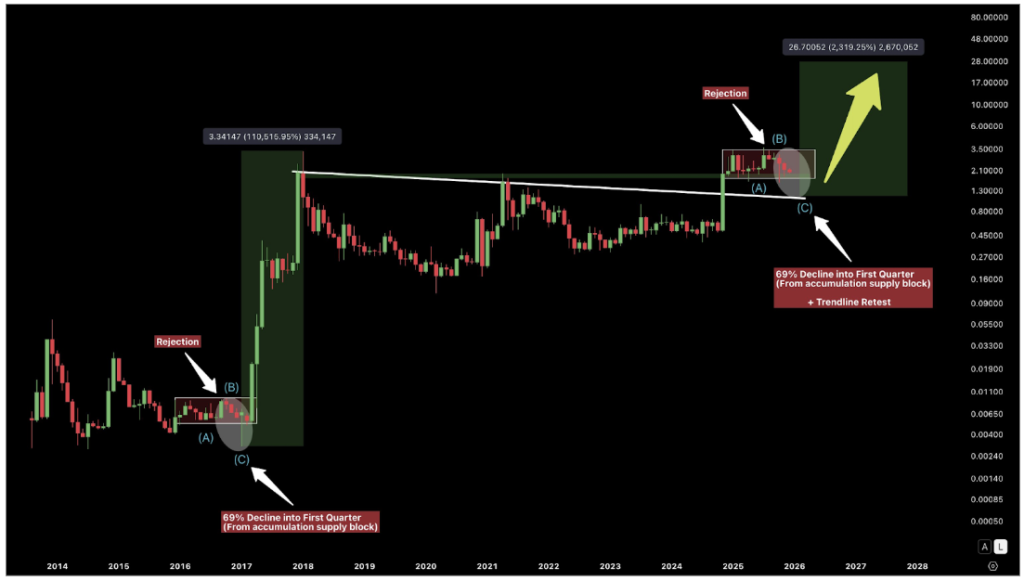
XRP price chart. Source: @ChartNerdTA
A possible decline could set the stage for a much bigger rally
XRP is currently trading at $2.04. Therefore, a deeper pullback below $1 will translate into a 51% drop from current price action. The idea of a deeper pullback from $2 is difficult to imagine. especially considering the influx in Spot XRP ETFs. In fact, a pullback of that magnitude could test the conviction of the entire market cause many bullish traders to move aside.
However, the technical analysis describes it as a structural reset and not as anything else. In 2017, post-crash consolidation laid the foundation for one of XRP’s most explosive rallies ever, ultimately delivering gains of over 110,000%.
Related reading
If this sequence plays out as expected, the real bullish opportunity would develop later in 2026. From that reset zone, the chart projects a long-term advance to the 1,618 Fibonacci extension, which places a potential upside target around $27. The visual projection in the chart above shows a clean expansion zone over several months that yields a 2,300% gain after the correction phase.
Featured image from Unsplash, chart from TradingView