

XRP price extended gains above the $0.6220 zone. The price tested the $0.6330 zone before pulling back amid declines in BTC and ETH.
- The XRP price started a downward correction from the $0.6330 zone.
- The price is now trading near USD 0.600 and the 100-hourly Simple Moving Average.
- A connecting bullish trendline is forming with support at $0.5920 on the hourly chart of the XRP/USD pair (Kraken data source).
- The pair could start to rise again if it remains above the $0.590 support zone.
XRP price holds uptrend support
XRP price extended its rise above the USD 0.6150 resistance. It even climbed above the resistance at $0.6220 before the bears appeared. It reached a high of $0.6330 before Bitcoin and Ethereum dragged the market lower.
There was a move below the USD 0.6150 and USD 0.6120 levels. The price fell below the 50% Fib retracement level of the upward move from the $0.5802 swing low to the $0.6330 high. It is now trading near $0.600 and the 100-hour Simple Moving Average.
A connecting bullish trendline is also forming with support at $0.5920 on the hourly chart of the XRP/USD pair. The trendline is close to the 76.4% Fib retracement level of the upward move from the $0.5802 swing low to the $0.6330 high.
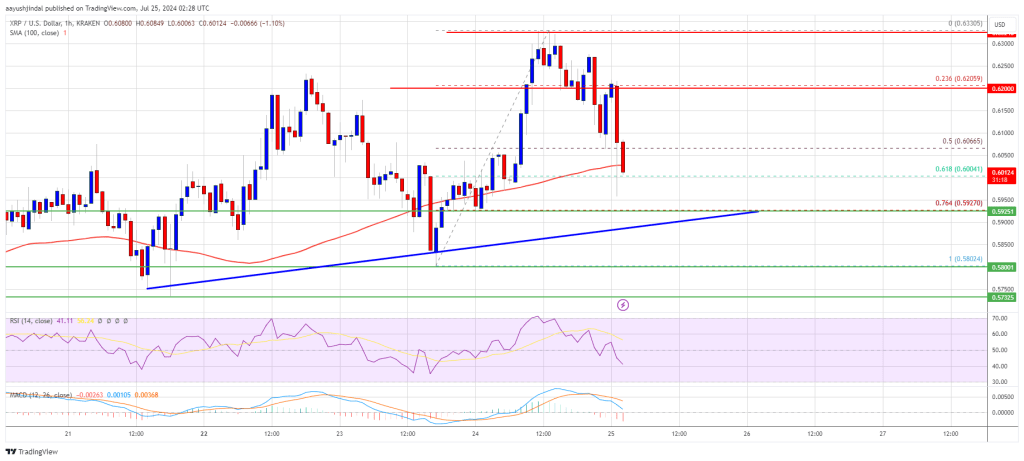
If a new upward move occurs, the price may encounter resistance near the $0.6120 level. The first major resistance is around the $0.6200 level. The next major resistance could be at $0.6220. A clear move above the USD 0.6220 resistance could send the price towards the USD 0.6350 resistance. The next major resistance is near the $0.6500 level. Any further gains could send the price towards the USD 0.680 resistance.
Lose more?
If XRP fails to break the USD 0.6120 resistance zone, it could continue falling. The initial downside support is near the $0.5950 level. The next major support is at $0.5920 and in the trendline zone.
If there is a downside break and a close below the USD 0.5920 level, the price could continue falling towards USD 0.580 in the near term.
Technical indicators
Hourly MACD – The MACD for XRP/USD is now gaining speed in the bearish zone.
Hourly RSI (Relative Strength Index) – The RSI for XRP/USD is now below the 50 level.
Major support levels – USD 0.5920 and USD 0.5800.
Major resistance levels – $0.6120 and $0.6220.