

XRP is nearing a decision point on the monthly and daily charts, with renowned crypto analysts The Great Mattsby (Matt Hughes) and Charting Guy (@ChartingGuy) framing the current structure as a volatility compression setup that could resolve higher if key high-frame supports hold.
XRP Price Poised for ‘Explosive Move’
Mattsby’s core claim is that XRP has defended its long-term trend support and is now looking for expansion. “XRP has had a perfect rebound off the 20-month MA as the upper and lower bands continue to contract – gearing up for the next explosive move higher,” he wrote, adding: “It’s crazy how many people are bearish at key support on a high time frame.”
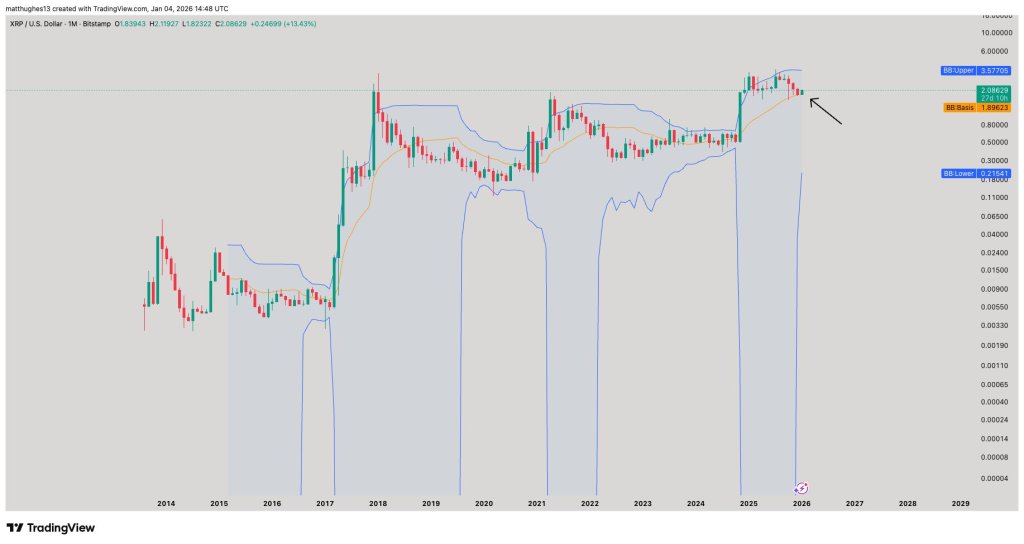
On the monthly chart, XRP is trading around $2.08629, above the Bollinger base near 1.89623, with the upper band at $3.57705 and the lower band at $0.21541. The visual conclusion is the pressure: the band envelope has tightened significantly compared to previous periods, a condition that Mattsby links to an ‘explosive’ directional follow-through when it disappears.
Related reading: Jake Claver Doubles His $100 XRP Target After Missing 2025
The other key input on that panel is the 20-month moving average, which Mattsby highlights as the linchpin. His October framing leans on historical rhyme: “XRP repeats what it did in 2017. Consolidating for months until it reached the 20-month MA. Then it shot up to complete the cycle.” According to him, the dynamic of touching and holding is already present in this cycle, even if it takes “a little longer.”
With the October 10 liquidation event, XRP broke through the 20-month moving average and has since consolidated above it. If true, the most explicit upside reference on the chart is the monthly Bollinger upper band around $3.57705, a level that would represent a return to the top of the current volatility envelope rather than an open-ended projection.
Wyckoff style reaccumulation points to $8
Guy’s daily chart is plotted over a Wyckoff-style roadmap and labels the series as a reaccumulation turning into markup.
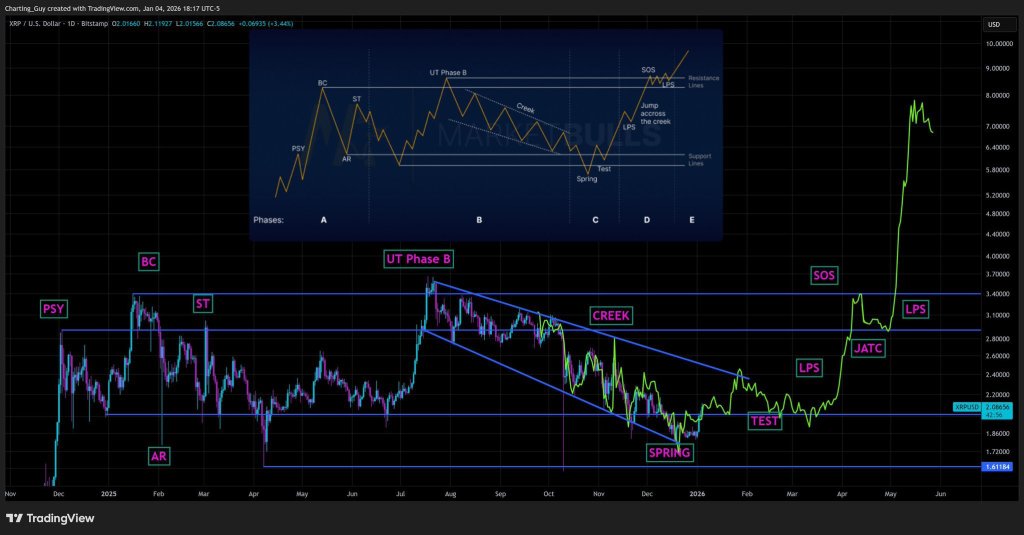
The yellow projection assumes that XRP is still operating through the overhead supply, with the ~$2.08 area (marked by the blue horizontal line and aligned with the current print) acting as the direct gatekeeper. In that context, $2.08 is not yet a support level in the comfort zone; it is a level that XRP must resolutely regain and then stay above on retests to continue validating the bullish range.
Related reading
A second constraint on the chart is the descending channel, the “creek” structure that defined the current downtrend. Charting Guy expects XRP to rally towards the upper trendline resistance, followed by a controlled pullback called ‘test’, where price checks whether demand is real and whether sellers can still force acceptance at the old range.
If that test holds (another short-lived dip below $2.08 is fine), the roadmap then looks for an “LPS” (final support point): a higher low that signals supply is being absorbed. Only then does the yellow trail call for “JATC” (jump the creek), the clean break through the channel, followed by “SOS” (sign of strength) to the next major horizontal ceiling around ~$3.40. From there, the schedule expects another break and “LPS” below that ~$3.40 zone, before the final markup phase accelerates to the ~$8 region.
In short, the chart’s bullish outcome depends on successive level flips: first $2.08, then the channel, then ~$3.40, and finally $8. So far, XRP is following the path “perfectly,” the analyst said noted via X.
At the time of writing, XRP was trading at $2.13.
Featured image created with DALL.E, chart from TradingView.com