

XRP is testing a key inflection zone above $2.00 as two independent frameworks from crypto analysts Dom (@traderview2) and Osemka (@Osemka8) converge on a potential reversal – with clearly defined levels around $2.00, $2.22 and $2.50 marking the battleground.
XRP price consolidation is nearing its end
The two-day chart with a higher timeframe features Osemka frames the structure as a classic flat correction built on top of the 2021 high. “Here’s the range and levels to help you navigate it. We’re basing it on the 2021 high,” he writes, adding that “we also never collapsed after being sideways for so long, so I stand by my view that this is an accumulation range and a flat correction.”
Related reading
His chart shows XRP oscillating in a horizontal band with the bottom aligned with the 2021 high, referred to as a “reaccumulation area.” The price has marked and bounced back from this support repeatedly, while mid-range resistance in the low to mid $2 zone has capped multiple rallies. Above, a higher horizontal line marks the January peak, which Osemka considers the cycle top.
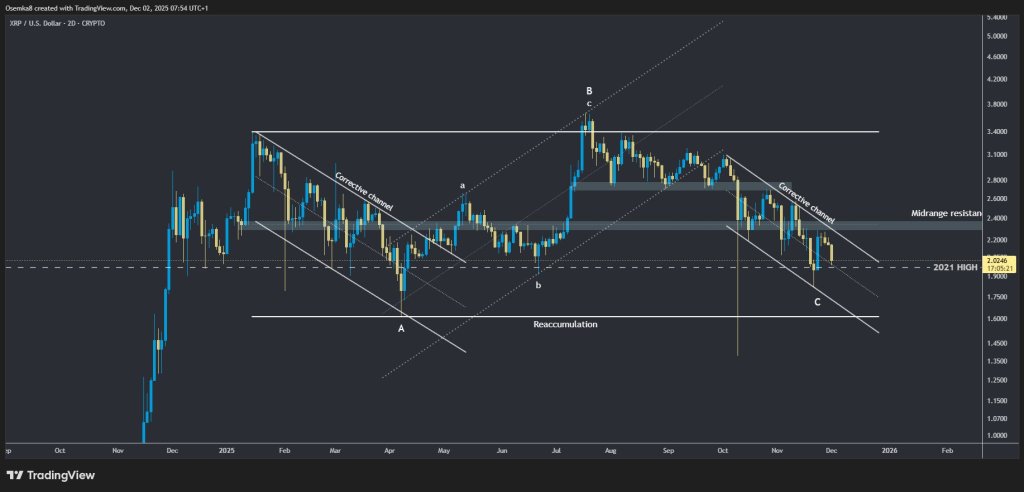
Internally he maps out a corrective series A – B – C. The B leg forms a dotted ascending channel, referred to as a three-legged “abc” wave. “That dotted rising range in the middle (three-legged ABC wave in B) makes me optimistic because that is a corrective move synonymous with a flat correction,” he explains. “This means that the top happened in January and that this is indeed just a sideways correction.” The current C-leg is in a downward “Corrective Channel” that points back to the lower band.
For Osemka, even a deeper test of support wouldn’t necessarily be bearish for the larger structure: “If we end up taking the bottom of the C-leg range, that remains to be seen. But if we do, it would be a great buying opportunity.” He also calls XRP “a perfect example of why I also see BTC in a flat correction with the top in January,” arguing that “while Bitcoin is messy, XRP is very clean.”
Why it’s now or never for XRP
Stupid zooms in over the last six weeks of that broader range and focuses on the microstructure that could trigger a move back into the upper band. “If you invert the chart over the last six weeks, you will see a perfect 3-drive pattern, a very accurate reversal setup in crypto,” he writes. On the non-inverted chart, this corresponds to three downward moves that fail to break lower, followed by what he calls a higher low: “We can see that an HL has finally formed which may indicate the first sign of a developing trend change.”

Its 8-hour chart emphasizes the monthly moving VWAP as the main lynchpin. “Bulls need to regain monthly rVWAP around $2.22 and that would be the shift for a rally back towards ~$2.50,” says Dom. That ~$2.50 area corresponds to higher VWAP clusters and the upper end of Osemka’s range.
Related reading
Order backlog and skew data support his view that conditions are ripe for a pause as buyers act. “Order books are clear, if there ever was a time, now is the time for this trend to change,” he notes, pointing to relatively clean liquidity overhead and a recovering skew after a faded short edge.

The downside is equally explicit: “If this scheme fails, sub-$2 adoption is next and the end of the year is ugly.” That would mean a decisive loss of the long-defended support band built at the 2021 height and a deeper completion of the C-leg in Osemka’s planar correction structure.
For now,
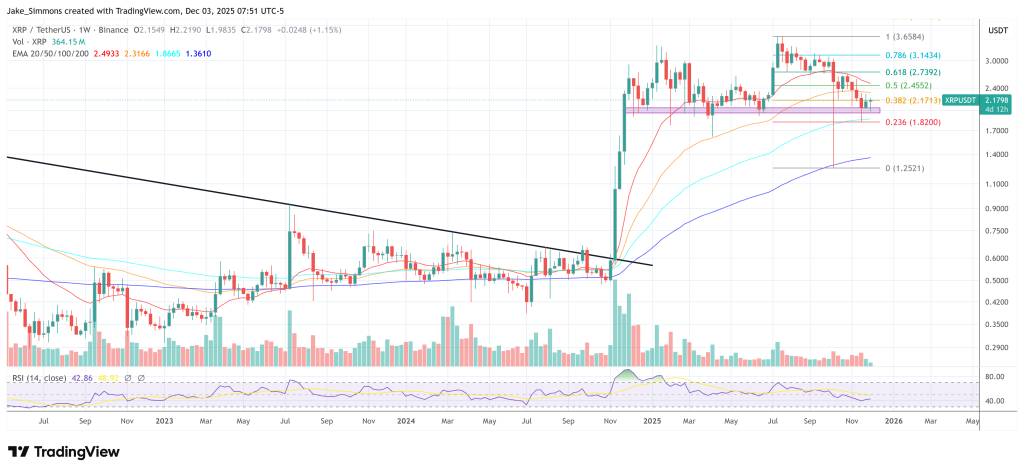
At the time of writing, XRP was trading at $2.1798.
Featured image created with DALL.E, chart from TradingView.com