

Bitcoin price struggled to reach the $59,500 level. BTC is moving lower and is now at risk of more downside towards the $56,000 level.
- Bitcoin started to decline again from the resistance zone at $59,475.
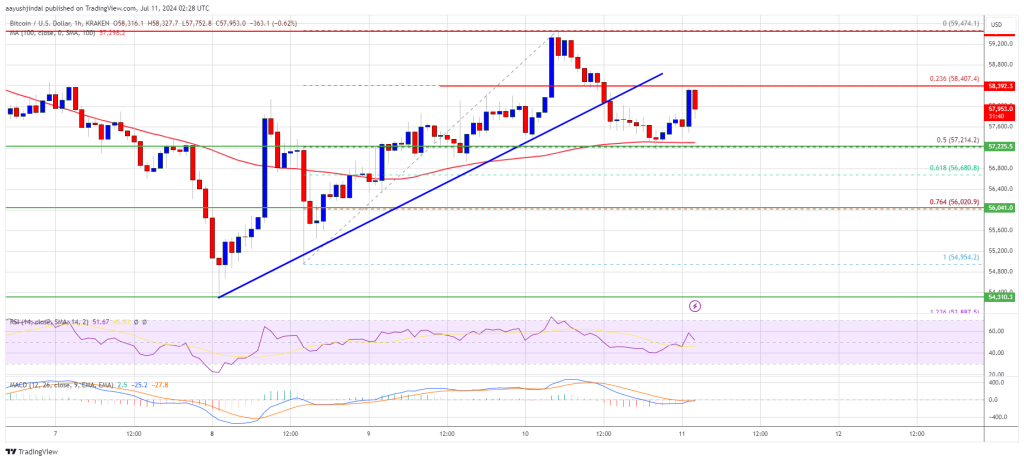
- The price is trading above USD 57,200 and the 100 hourly Simple Moving Average.
- There was a break below a key bullish trendline with support at $57,900 on the hourly chart of the BTC/USD pair (data feed from Kraken).
- The pair could start another big decline if it fails to hold above the $57,200 support.
Bitcoin price is facing trouble
Bitcoin price extended its recovery wave above the USD 57,500 level. BTC even climbed above the USD 58,500 level. However, the bears are active near the USD 59,500 resistance zone.
It reached a high at $59,474 and the price is now correcting gains. There was a move below the USD 58,500 level. The price tested the 50% Fib retracement level of the upward move from the $54,955 swing low to the $59,474 high. Additionally, there was a break below a key bullish trendline with support at $57,900 on the hourly chart of the BTC/USD pair.
The bulls seem to be active above the USD 57,200 level. Bitcoin price is now trading above $57,200 and the 100 hourly Simple Moving Average. The immediate resistance on the upside is near the $58,400 level.
The first major resistance is near the $58,800 level. A clear move above the USD 58,800 resistance could trigger a decent upside in the coming sessions. The next major resistance could be at USD 59,500. The next big hurdle is at $60,000. A close above the $60,000 resistance could trigger a steady rise and send the price higher. In the mentioned case, the price could rise and test the USD 62,500 resistance.
Lose more in BTC?
If Bitcoin fails to climb above the USD 58,400 resistance zone, it could trigger another decline. The immediate downside support is near the $57,200 level.
The first major support is at $56,000 and the 76.4% Fib retracement level of the upward move from the $54,955 swing low to the $59,474 high. The next support is now near $55,000. Any further losses could send the price towards the $53,500 support zone in the near term.
Technical indicators:
Hourly MACD – The MACD is now losing pace in the bullish zone.
Hourly RSI (Relative Strength Index) – The RSI for BTC/USD is now above the 50 level.
Major support levels – USD 57,200, followed by USD 56,000.
Major resistance levels – $58,400 and $59,500.