

- The falling wedge breakout indicates bullish potential and targets $24 with $10.88 as key resistance.
- Positive metrics, including oversold RSI and strong social sentiment, reinforce Polkadot’s rally potential.
Polka dot [DOT] has broken out of the falling wedge pattern on the weekly time frame, a crucial signal that often precedes significant bullish rallies.
Trading at $6.83 at the time of writing, down 1.98% at the time of writing, the cryptocurrency’s breakout and retest phase presents a promising opportunity for traders. The next key question is whether DOT can maintain this momentum and recover towards its medium-term target of $24.
DOT’s Breakout and Price Prediction
The break of the falling wedge on Polkadot’s chart highlights strong potential for a bullish reversal. The price is now facing its first major resistance at $10.88, with a medium-term target of $24.
Additionally, the recent retest of the breakout level strengthens the technical outlook, suggesting buyers are entering at critical levels. Therefore, DOT’s trajectory appears poised for a substantial upside, provided the momentum continues.
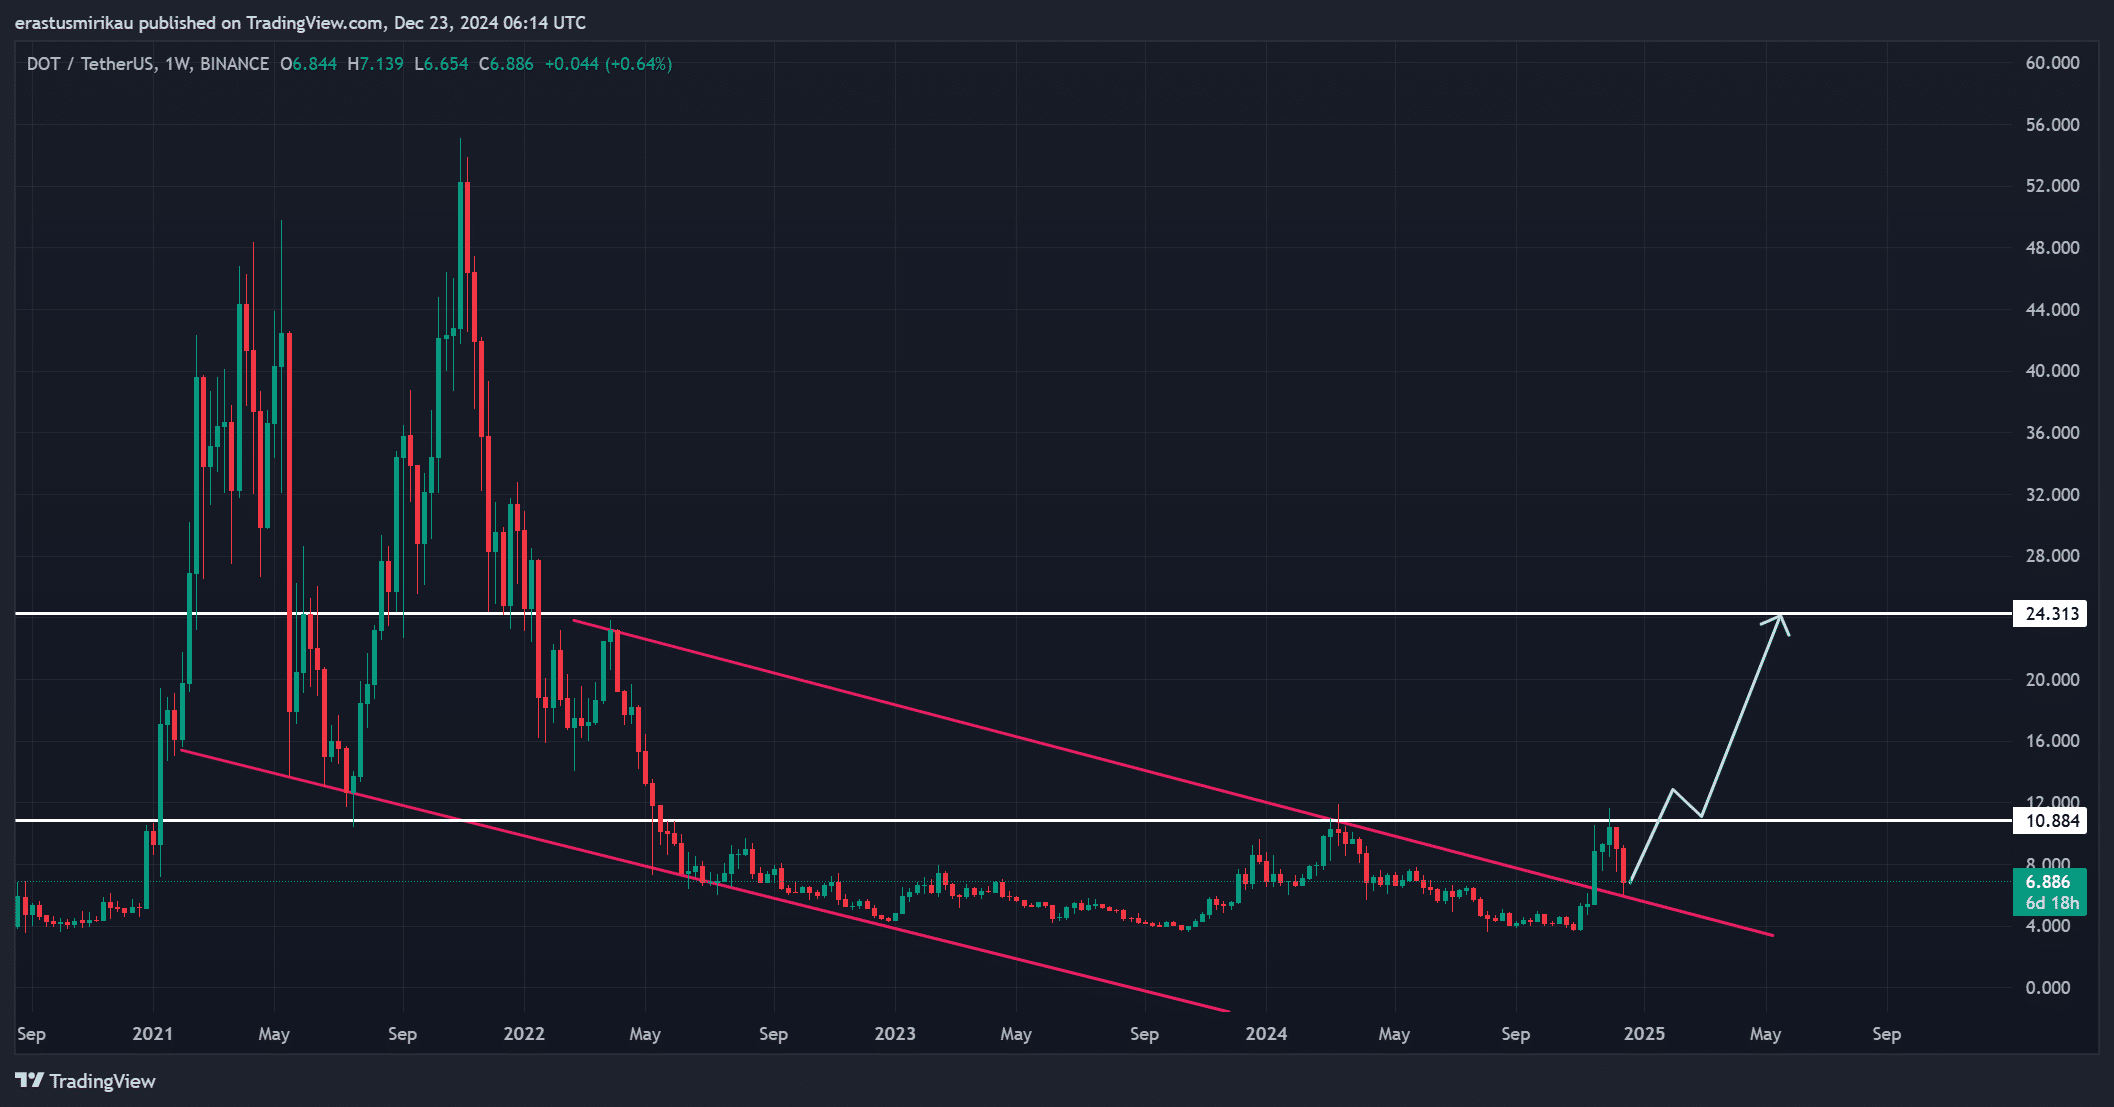
Source: TradingView
Analysis of the stochastic RSI and moving averages
Technical indicators further support Polkadot’s bullish potential. The stochastic RSI shows oversold conditions, with values near 3.03 and 4.01, indicating a potential near-term price recovery.
While the moving average (MA) crossover on the daily chart indicates near-term consolidation, it also suggests that the DOT could soon reverse its downtrend.
Together, these indicators point to a promising outlook for the cryptocurrency in the coming weeks.
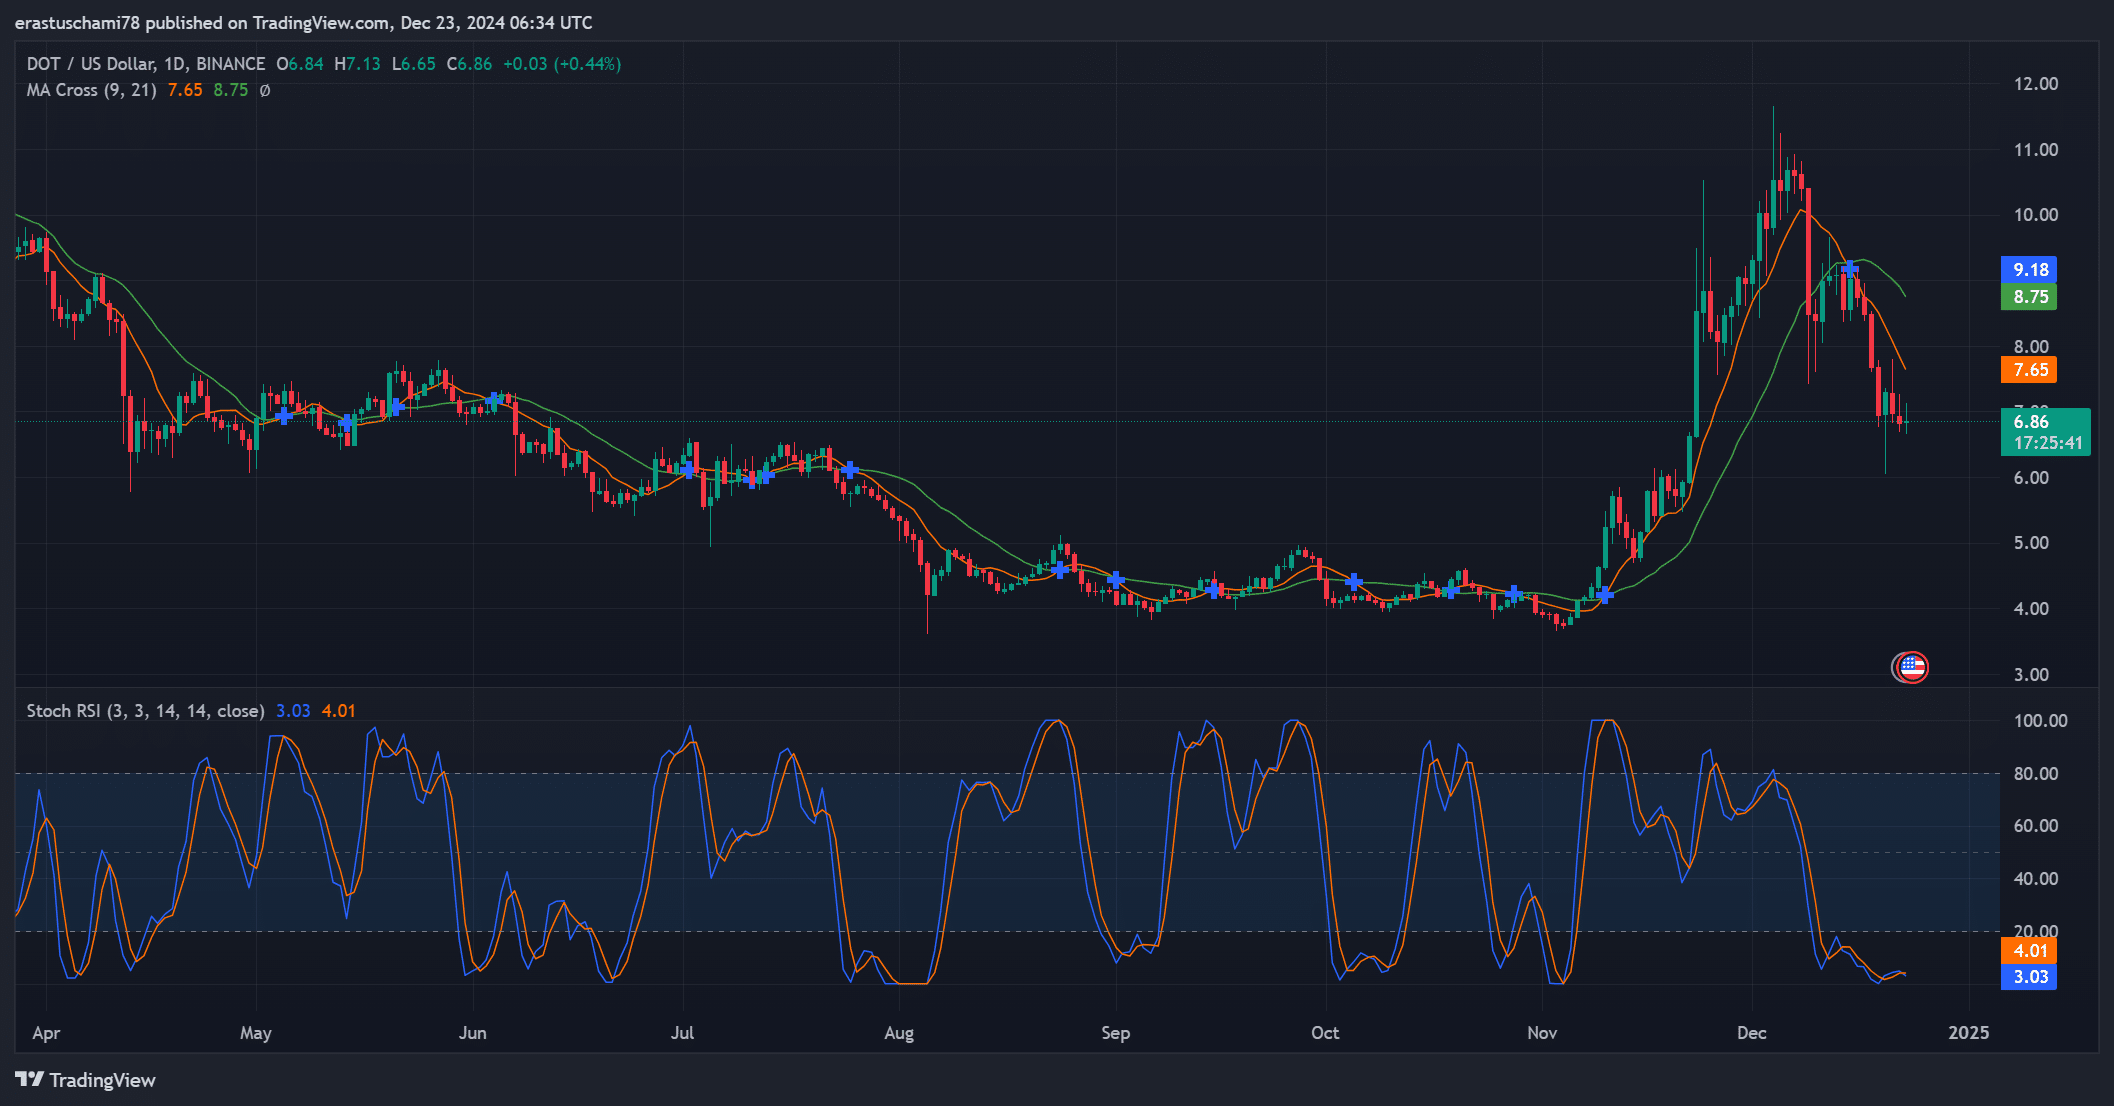
Source: TradingView
Social volume data, 105, indicates increasing interest in Polkadot as community engagement continues to increase across platforms. This increased activity, visible through consistent spikes, often correlates with a renewed interest in the asset.
Therefore, the narrative around Polkadot’s bullish potential continues to grow, creating a positive feedback loop for both sentiment and price action.
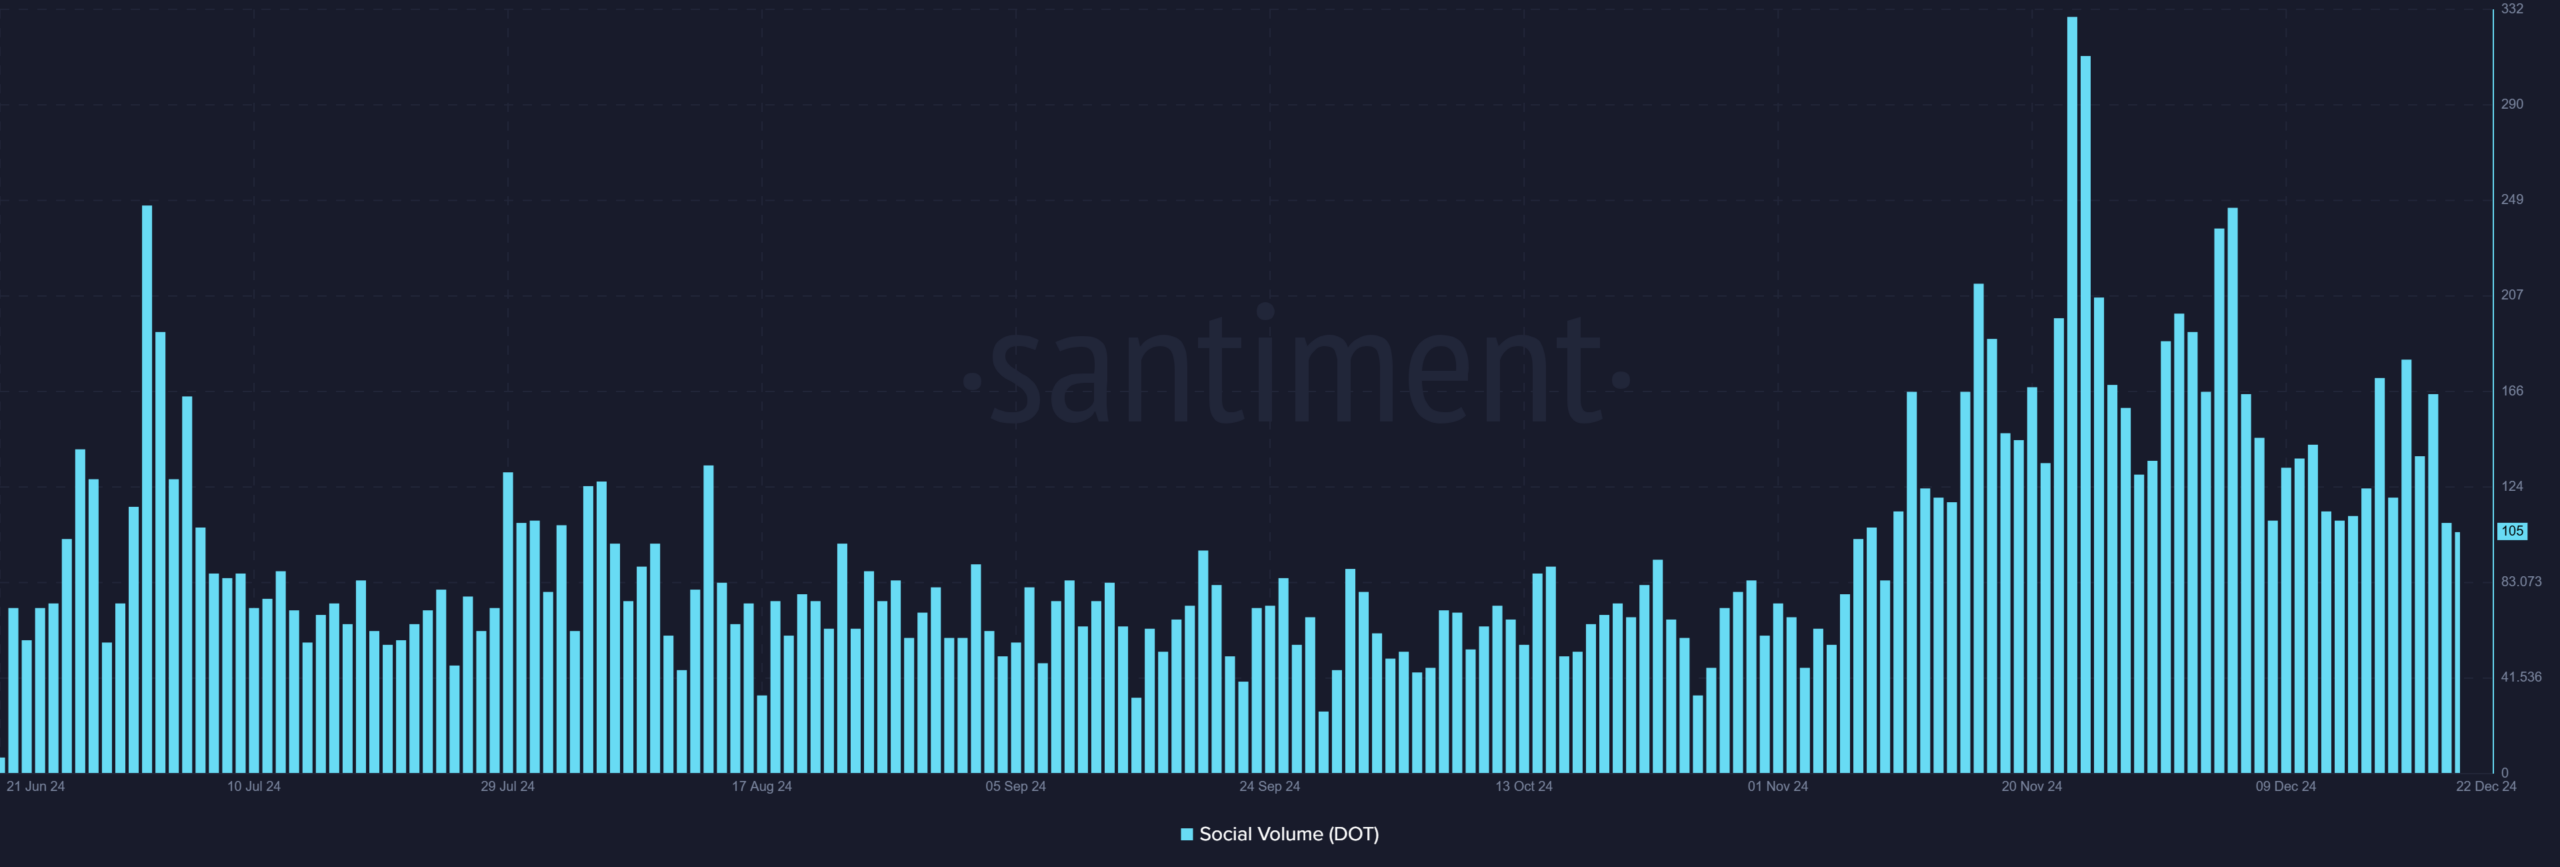
Source: Santiment
The DOT derivatives market supports the bullish outlook
Polkadot’s total liquidations show $207.51K in long liquidations, compared to $177.75K in shorts, indicating growing confidence among long traders. Moreover, the OI-weighted financing rate remains positive at 0.01%, reinforcing bullish sentiment.
These numbers indicate that Polkadot is gaining momentum in the derivatives market, further strengthening its upside potential.
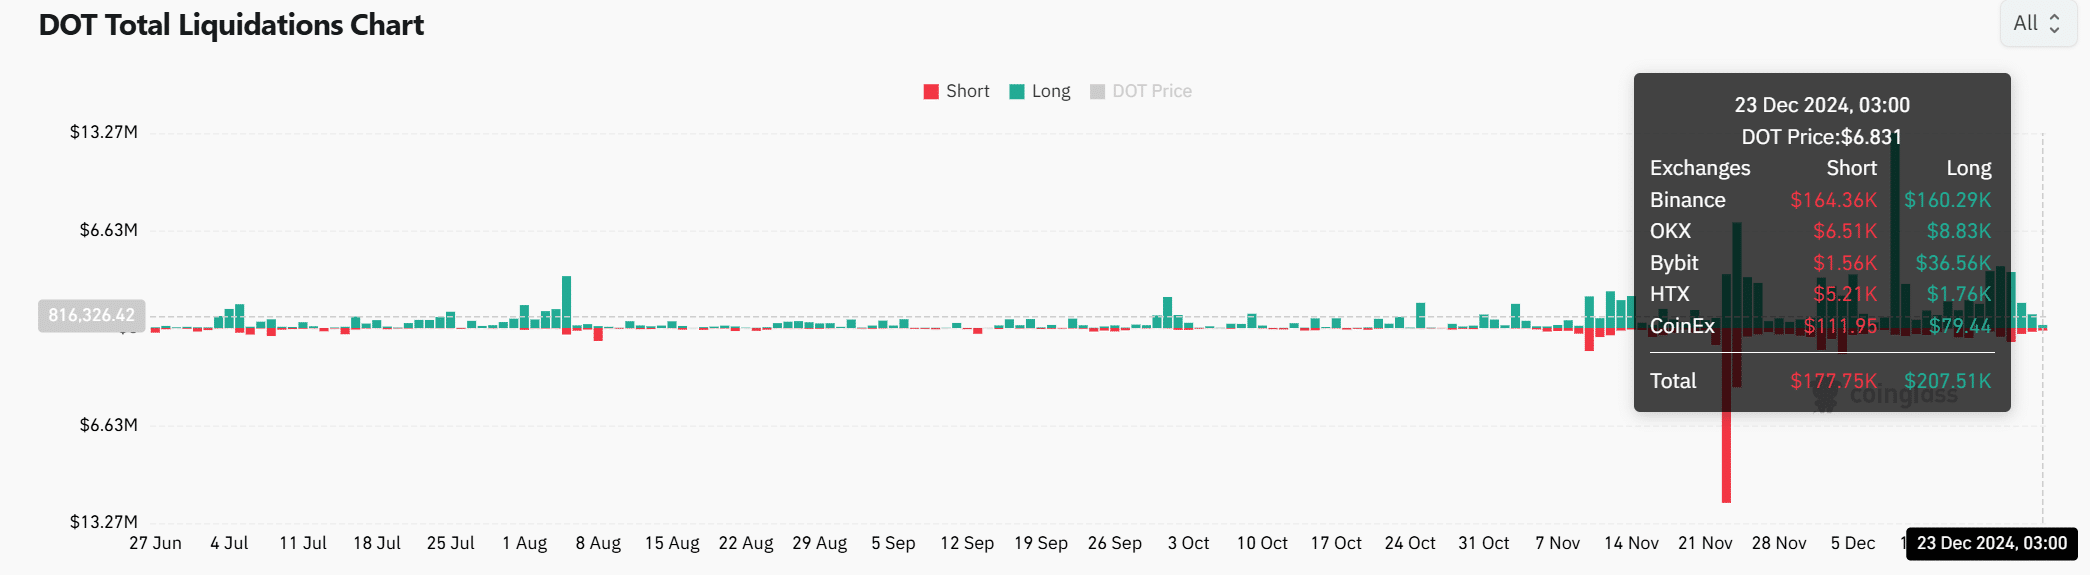
Source: Coinglass
Read Polkadot [DOT] Price forecast 2024-2025
With the falling wedge breakout, bullish technical indicators, and growing momentum in social and derivatives, Polkadot appears well positioned for a rally.
While overcoming the resistance at USD 10.88 is essential, the medium-term target of USD 24 is achievable if the current momentum continues. Polkadot is undoubtedly on its way to a big breakthrough.