- The price of Bitcoin has risen 4% over the past seven days.
- Market indicators pointed to a price correction.
The entire crypto market has seen a bull rally over the past week, with top coins posting double-digit gains.
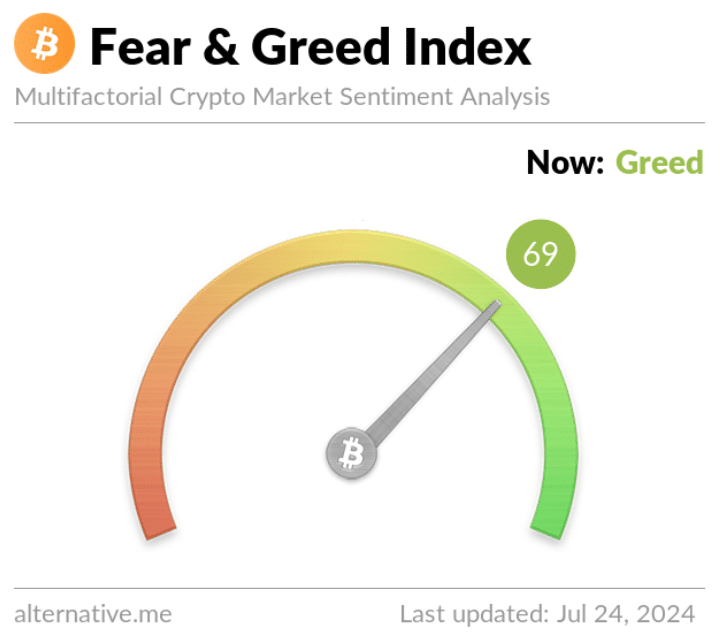
However, the crypto fear and greed index was at a “greed” position at the time of writing, suggesting a trend reversal could happen soon.
What the crypto fear and greed index suggests
The price of the king’s coin, Bitcoin [BTC], remained bullish over the past week as it traded above the psychological resistance at $65k. From CoinMarketCapthe price of BTC rose by more than 4% in seven days.
At the time of writing, BTC was trading at $66,744 with a market cap of over $1.29 trillion. Besides Bitcoin, Ethereum [ETH] Bulls also dominated the market as the price rose more than 2% over the past seven days.
AMBCrypto then looked at the fear and greed index to see if the market was gearing up for a correction.
According to our analysis, at the time of writing, the crypto fear and greed index had a value of 69, meaning the market was in a ‘greed’ phase.
When the indicator reaches that level, it indicates that the probability of a price correction is high.


Source: Alternative.me
Will BTC cause the downtrend?
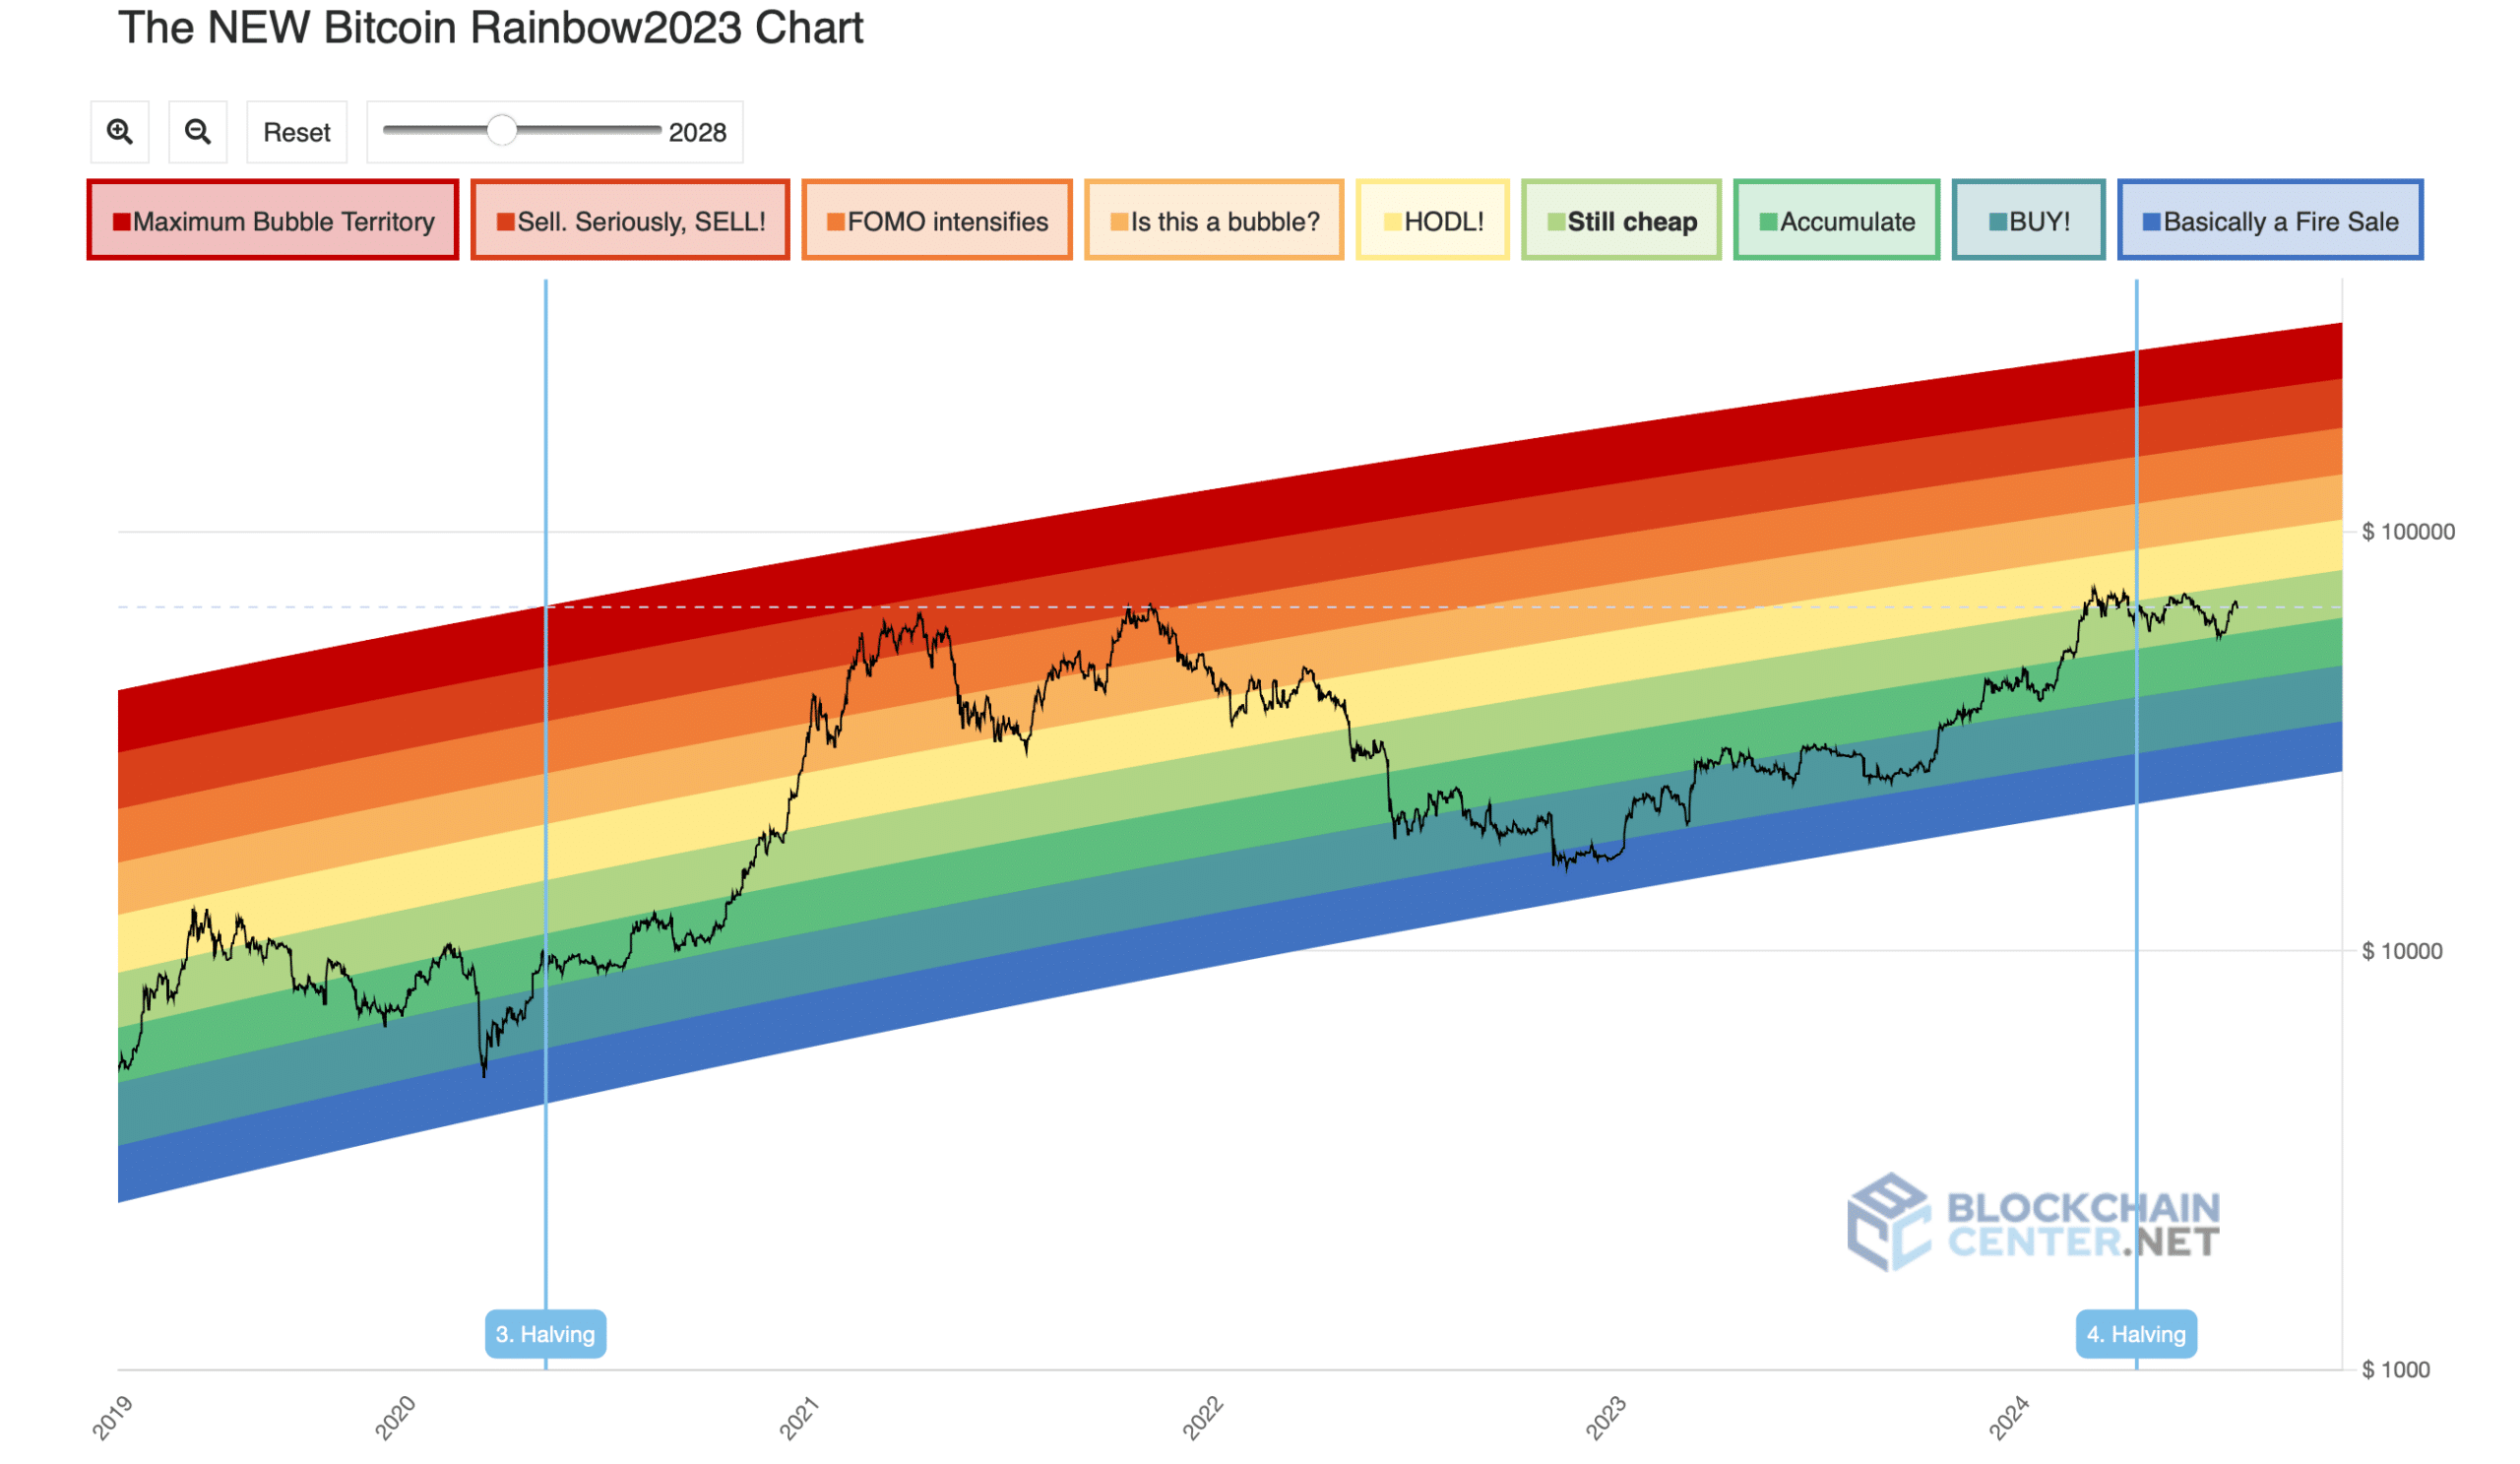
AMBCrypto then checked BTC’s rainbow chart to see if it indicated a price correction, which could result in a full market correction.
According to our analysis, BTC’s rainbow chart suggested that the coin was still cheap to buy. This clearly meant that investors still have the opportunity to accumulate more BTC before the price skyrockets.
According to the chart, BTC could reach $1.23 million before the market enters a FOMO phase.


Source: Blockchaincenter
AMBCrypto then looked at CryptoQuant’s facts to find out what statistics suggested. We found that BTC’s exchange reserve fell, meaning selling pressure on the coin was low.
Things in the derivatives market also looked quite optimistic as BTC’s funding rate increased. However, the Taker Buy Sell Ratio turned red. This meant that derivatives investors were selling BTC at the time of writing.


Source: CryptoQuant
Read Bitcoins [BTC] Price prediction 2024-25
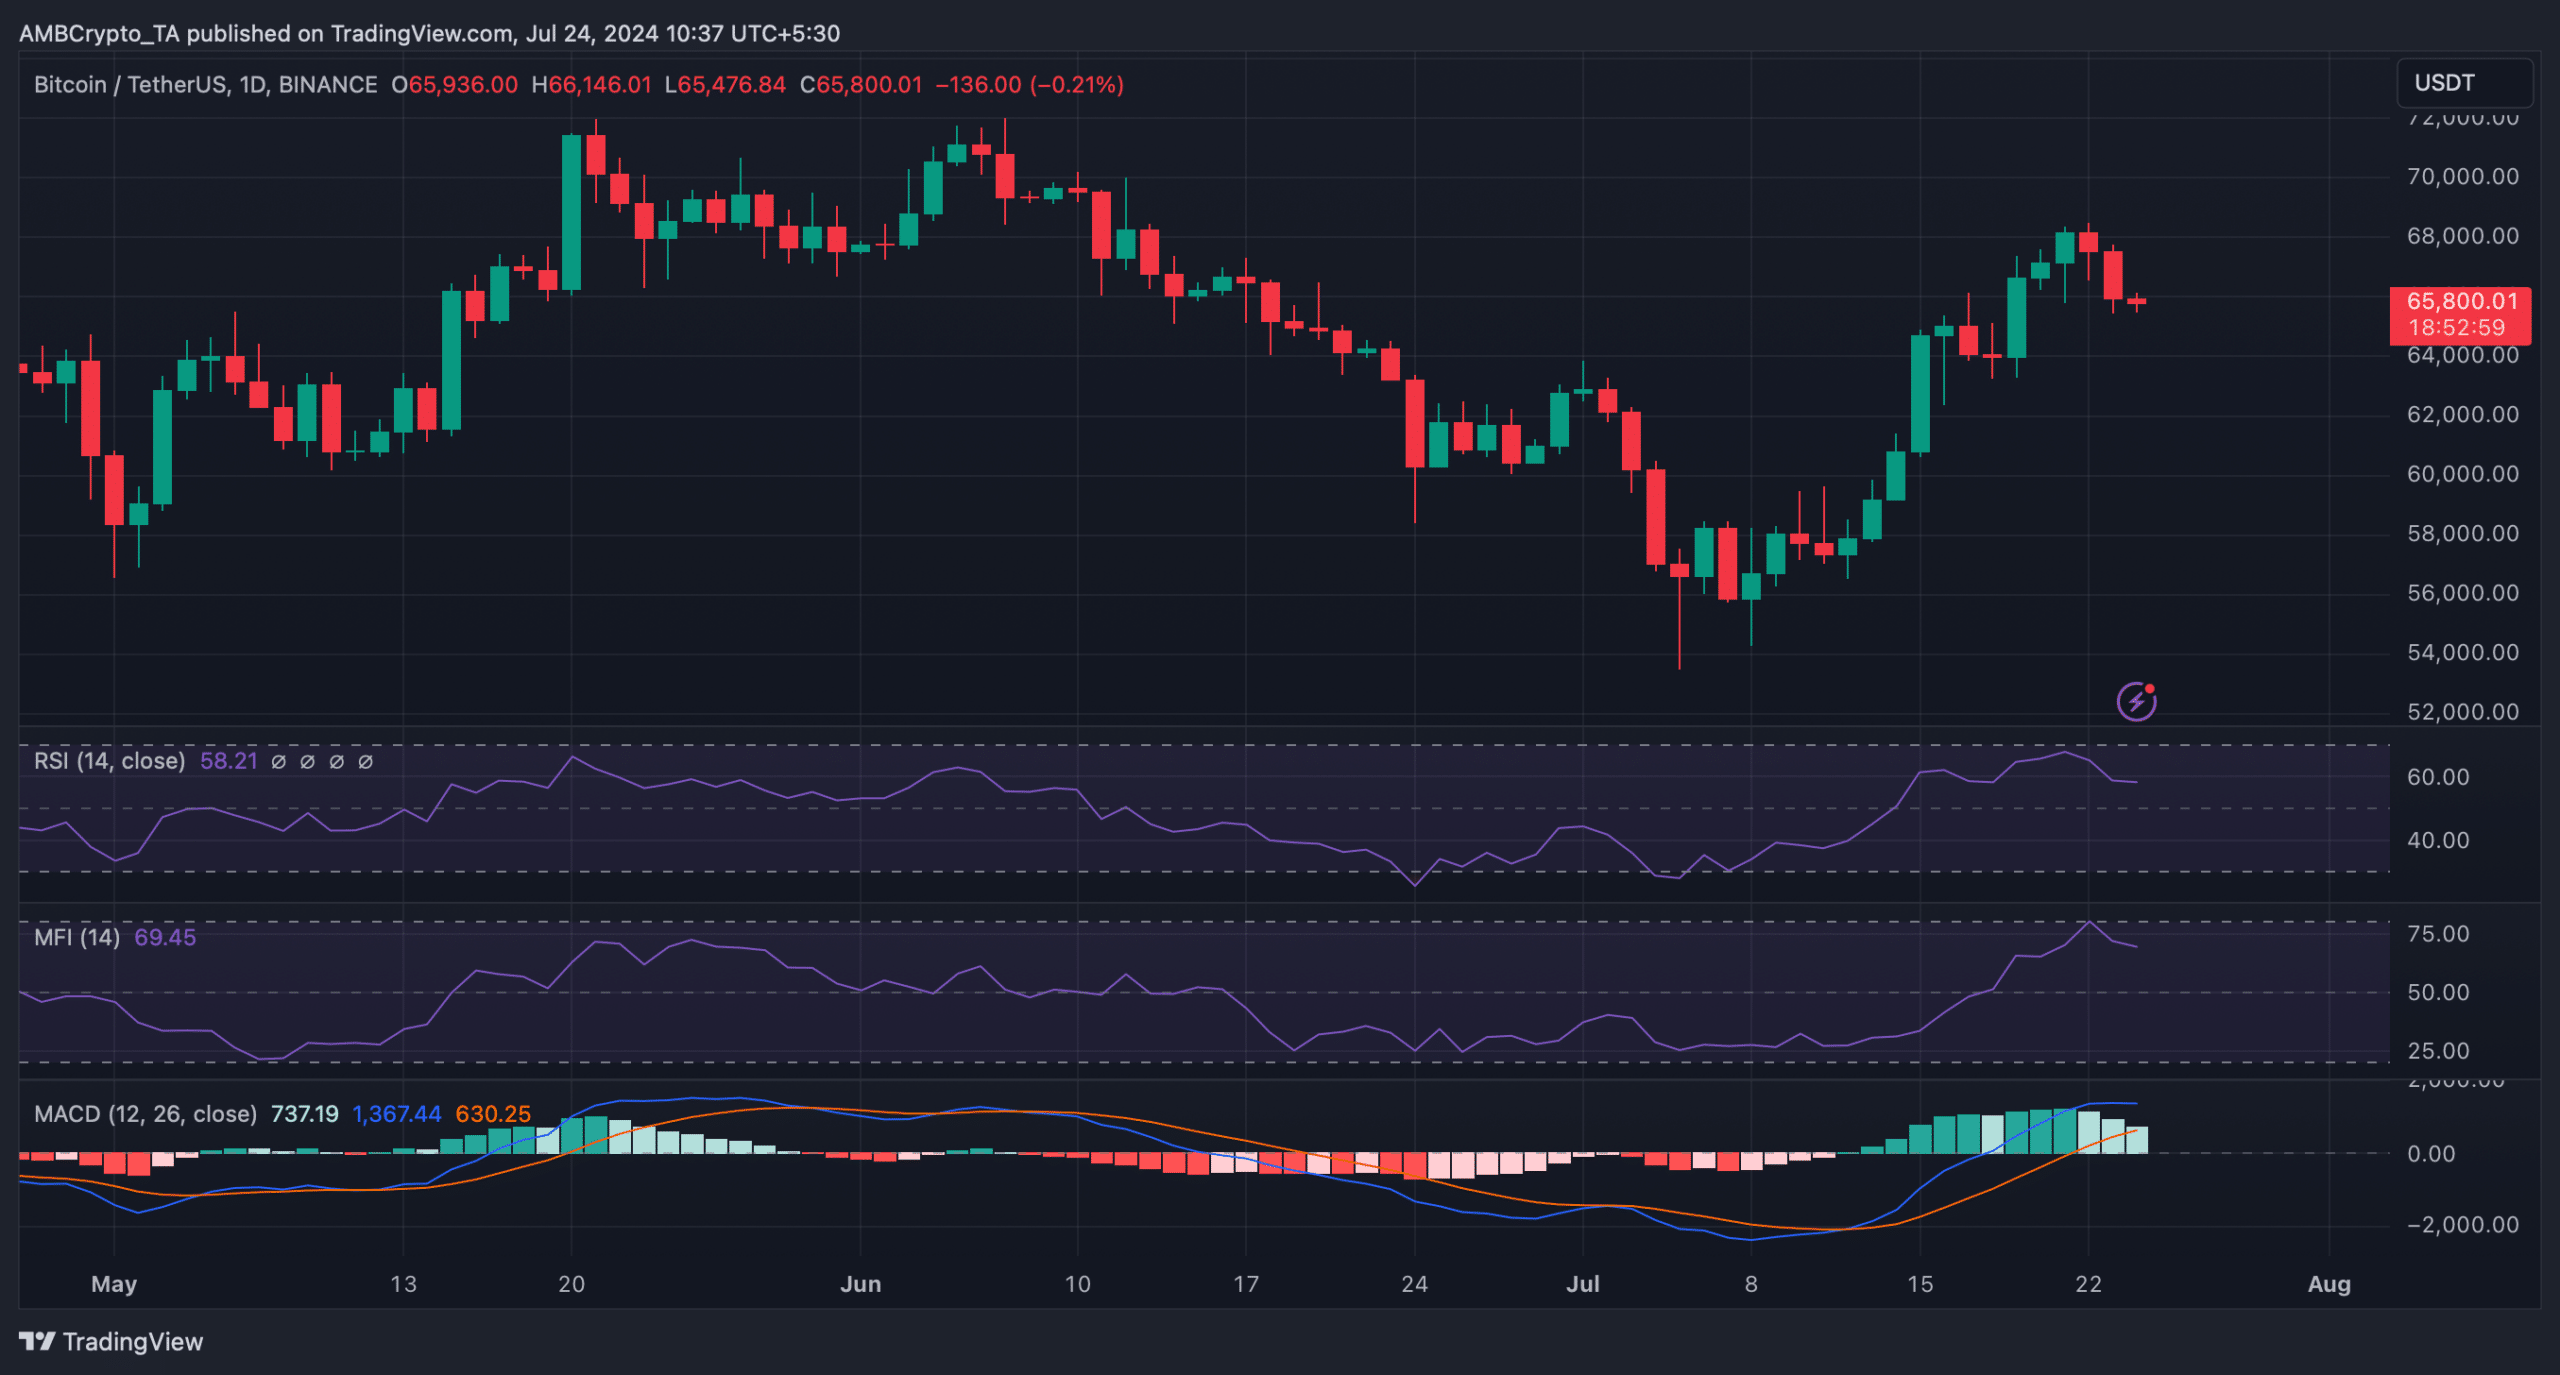
The market indicators looked quite bearish on the coin. For example, the Relative Strength Index (RSI) registered a decline. The Money Flow Index (MFI) also followed a similar trend as it headed south.
This clearly showed that the chance of a price correction was high. Nevertheless, the MACD remained in favor of the bulls, indicating continued price appreciation.


Source: TradingView

