Shiba Inu (SHIB) price is once again at a critical crossroads. Currently, it is down a whopping 91% from its all-time high (ATH) of $0.00008845 recorded in October 2021. Over the past year, the token has been on a consistent downtrend, marking lower highs and lower lows in the monthly time frame. . But not all is bleak for SHIB investors.
The recent relaunch of Shibarium, a layer 2 blockchain, is a beacon of hope. This move is seen as Shiba Inu’s attempt to move from its meme coin status to a more serious player in the crypto world, aiming to enable applications for millions of people across a massive ecosystem.
Shiba Inu faces a double-edged sword
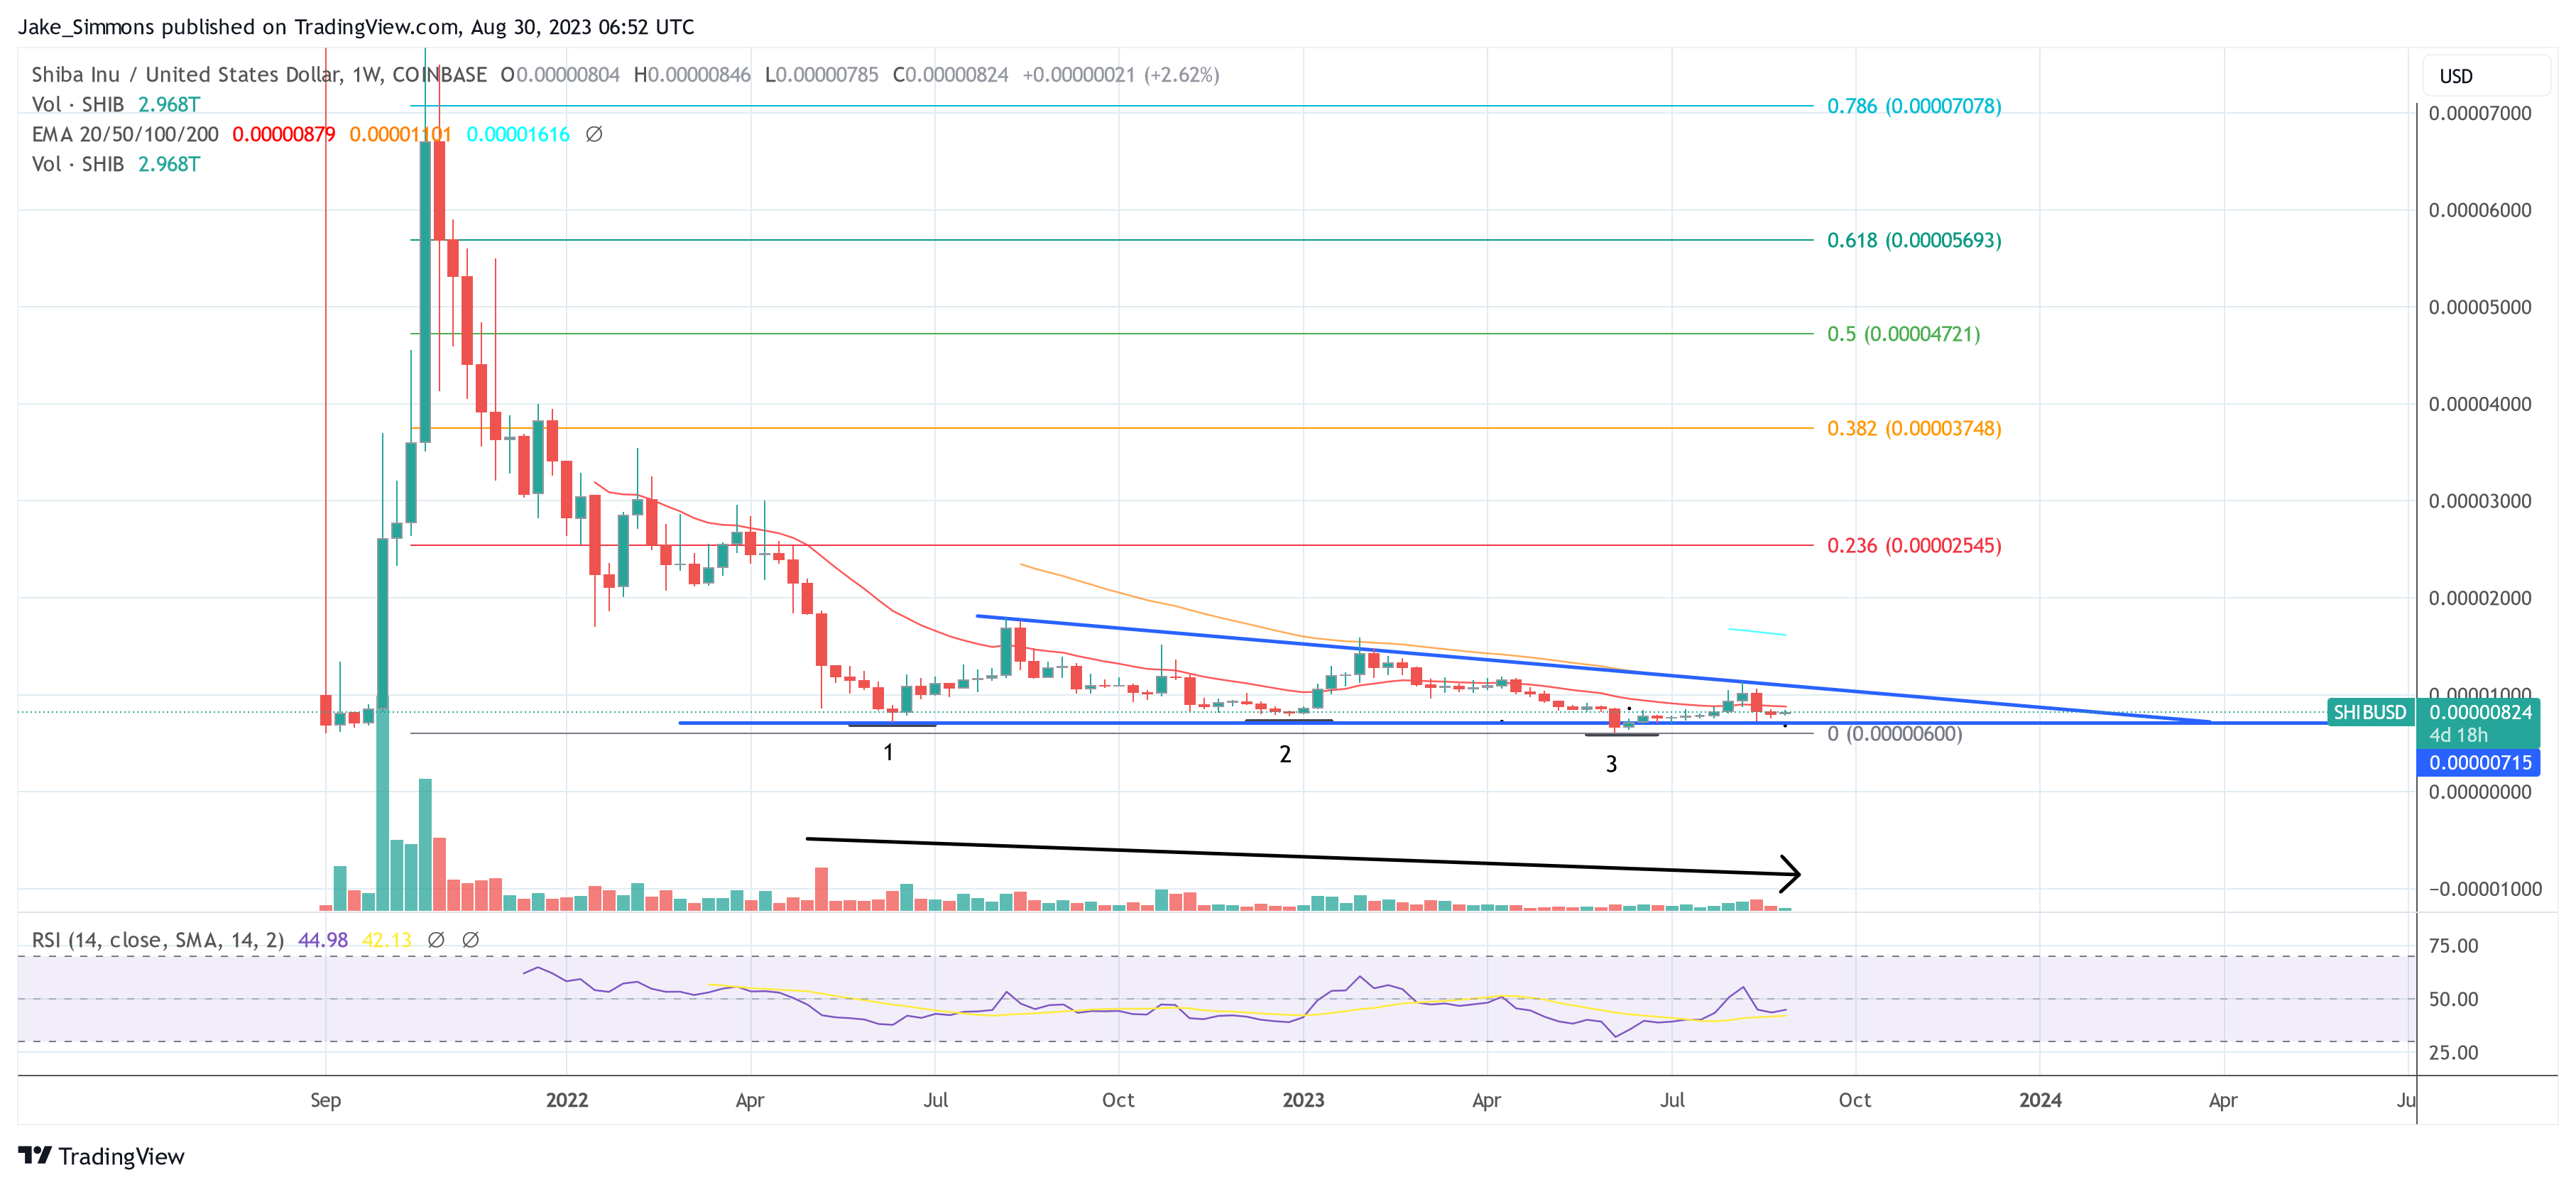
From a technical chart analysis perspective, there is another glimmer of hope: the formation of a triple bottom pattern. This pattern, if validated, could spell the end of SHIB’s two-year downtrend. However, it is a double-edged sword. If this pattern is nullified, it could turn into a descending triangle, potentially driving SHIB to a new low.
A closer look at SHIB’s weekly chart reveals the formation of this triple bottom pattern. A triple bottom is a bullish chart pattern. It is characterized by three roughly equal lows bouncing off a support level followed by a breakout above resistance. This visual pattern indicates a power shift from sellers (bears) to buyers (bulls).
Remarkably, the formation of a triple bottom is often seen as an opportunity for traders to take a bullish position, especially after a prolonged bearish trend, as is the case with SHIB. A few lines typically qualify triple bottoms.
An existing downtrend must precede the pattern. SHIB ticks this box. Second, the three lows should be roughly equal in price, allowing for a horizontal trendline. SHIB also meets this criterion. Third, volume should decrease throughout the pattern, indicating weakening bears, while bullish volume should increase as price breaks through the last resistance. The chart highlights this for SHIB.

To get into the details, SHIB’s first bottom was recorded when it fell to $0.00000715 in June 2022. A subsequent recovery was short-lived, with SHIB falling to the second floor in December 2021 at $0.00000781. The third bottom was formed. at $0.0000060 in June 2023, after another recovery attempt ran into resistance and marked a lower high.
The danger, however, lies in the striking resemblance between the triple bottom and the descending triangle. If the support breaks at $0.00000715, SHIB could validate the descending triangle and target the previous yearly low at $0.000006. Maintaining this level is crucial; otherwise, SHIB could be entering uncharted territory.
It is worth noting that traders often look for confirmation of a triple bottom by using other technical indicators. An oversold Relative Strength Index (RSI) is one such indicator. Currently, SHIB’s weekly RSI stands at 45 (neutral), which leans more towards the possibility of a bearish triangle pattern.
But when the triple bottom materializes, the rewards could be significant. The first major target for SHIB could be the 23.6% Fibonacci retracement level at $0.00002545, which translates into a potential gain of about 200% from the current price.
Featured image from Euro Weekly News, chart from TradingView.com

