
, Litecoin (LTC), and Binance Coin (BNB) Prices Set for an Uptick")
The crypto market recently outlasted July CPI data, causing Bitcoin to consolidate around $29.5K. The SEC’s recent delay in filing for BTC ETFs has left investors with no choice but to invest in altcoins. For the past week, meme coins dominated the market with Shiba Inu (SHIB) leading the way. However, altcoins such as Ripple’s XRP, Litecoin (LTC) and Binance Coin (BNB) will be the focus next week.
Altcoin season is coming, expert predicts
Over the past three weeks, the daily altcoin market cap has hovered around $230 billion. To complete the h&s pattern, it needs to cross the $300 billion mark, said senior analyst Olszewicz.
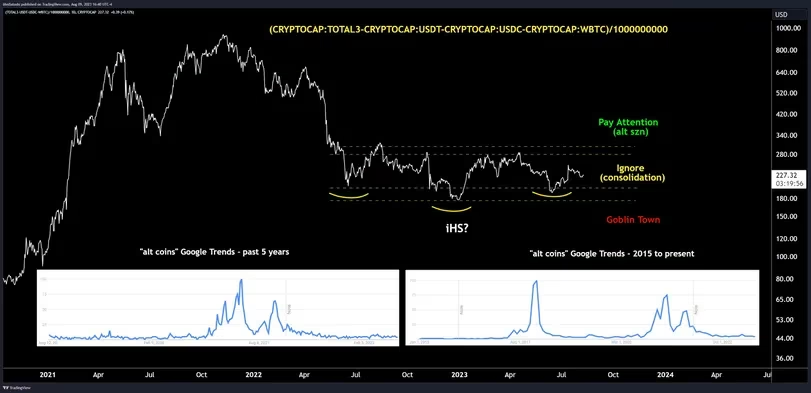
Olszewicz noted a potential triple bottom or inverted head-and-shoulders in the altcoin market cap, but remains skeptical of the pattern amid this consolidation. He is waiting for a step above $300 billion. The current chart suggests two outcomes: either the market cap declines, negating the inverse head-and-shoulders pattern, or it crosses $300 billion, signaling the start of an altcoin surge.
Ripple (XRP) price analysis
XRP pulled out of the 50-day EMA at $0.65, suggesting bears are trying to turn this into a resistance point. Currently, XRP price is consolidating between EMA lines, which means buyers are preparing for a storm next week.
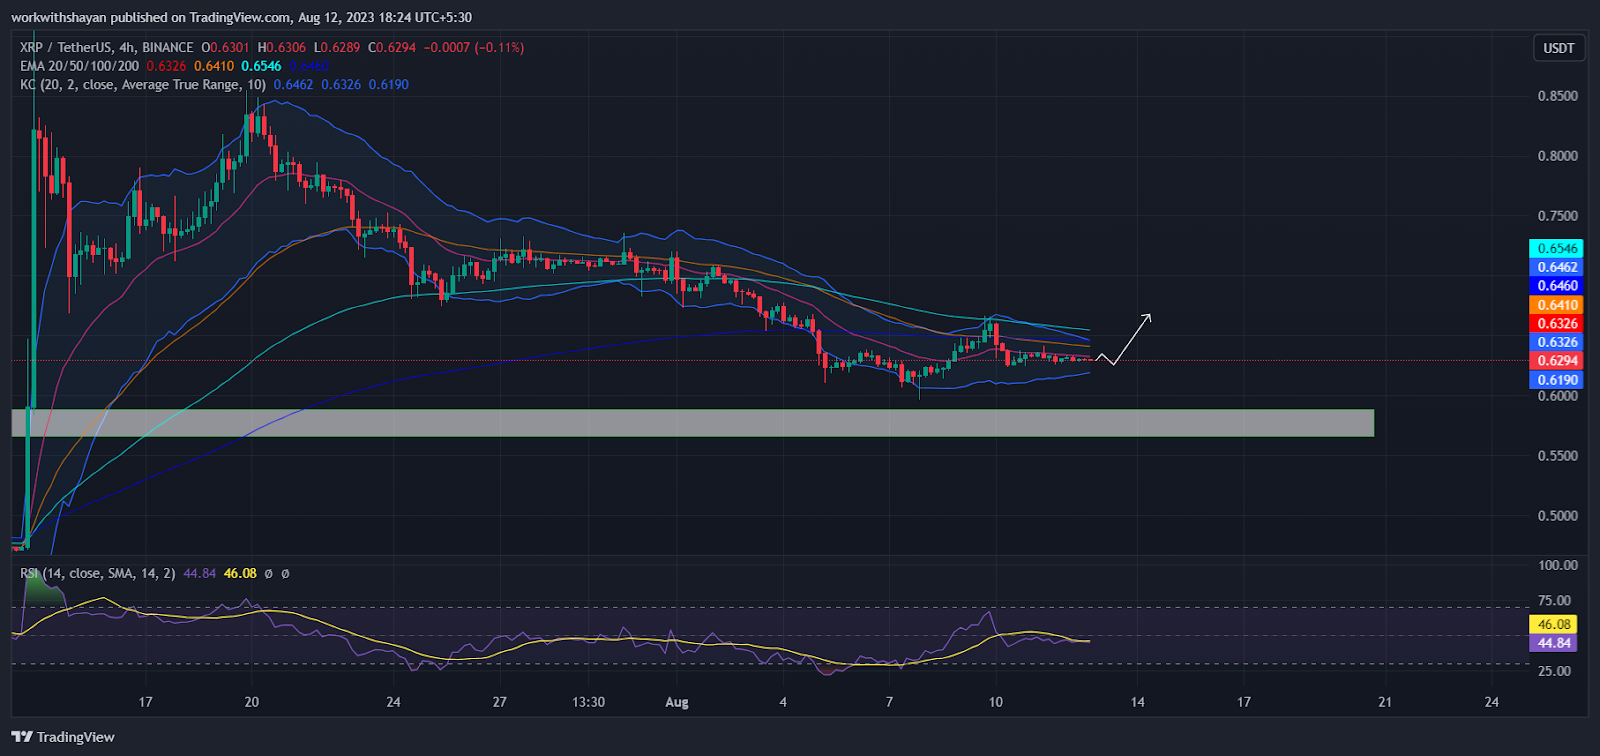
The critical support to check is the $0.6 level. If this support falls, selling pressure could increase, pushing the XRP price towards $0.56.
However, if the price rises from the 50-day EMA, it may stabilize for a while and float between these averages. A successful rise and stabilization above USD 0.67 would indicate a bullish trend, possibly leading to a recovery rally to USD 0.73.
Litecoin (LTC) price analysis
Litecoin (LTC) is facing challenges to initiate a rebound from its bearish zone. However, buyers are successfully defending the $82.5 immediate support level, signaling a robust recovery rally next week. Nevertheless, the falling EMA trendlines and trading at the RSI level near the centerline indicate bearish pressure on the price chart.

If the LTC price falls and stays below USD 81 consistently, it would indicate a renewal of the bearish trend. After that, the supports to watch are $79 and then $75.
On the other hand, bulls may be preparing for a breakout above $85. If the market’s bulls drive the price past this level, it could signal the start of a more powerful recovery, possibly to $95 – a point where intense selling pressure from bears could re-emerge.
Binance Coin (BNB) Price Analysis
The BNB price has sparked a robust recovery rally over the past few hours, aiming to regain old momentum. Bulls bought heavily near the $238 low.
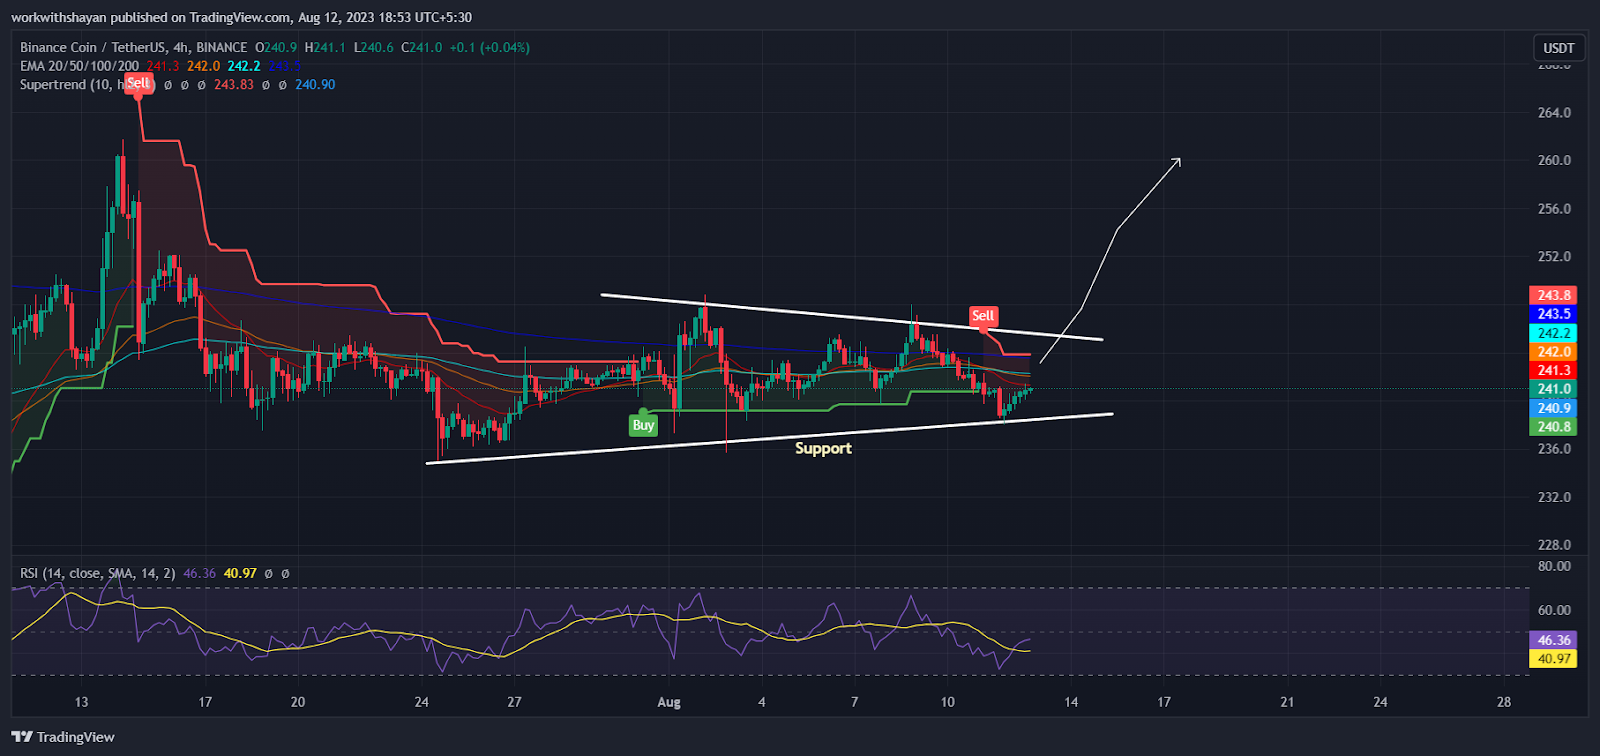
If the BNB price falls to the support line of the triangle, there may be an increase in selling activity. It is critical to keep an eye on this level as a drop below this point could initiate the next downward phase to $228 where the bulls are expected to benefit from the dip.
If the breaks break above the triangle pattern next week, the price could lead to solid buys. This momentum could push BNB to $260.