
 decline increases – Bears tighten grip, recovery seems unlikely")
Solana started a new decline below the $180 zone. SOL price is now consolidating losses below USD 175 and could decline further below USD 165.
- The SOL price started a new decline below $180 and $175 against the US dollar.
- The price is now trading below $175 and the 100-hour moving average.
- A major bearish trendline is forming with resistance at $191 on the hourly chart of the SOL/USD pair (Kraken data source).
- The price could stage a recovery wave if the bulls defend $165 or $162.
Solana price drops further
Solana price failed to hold steady above $185 and started a new decline, just like Bitcoin and Ethereum. SOL fell below the USD 182 and USD 180 support levels.
The price gained bearish momentum below $175. A low was formed at $163, and the price is now consolidating losses with a bearish angle below the 23.6% Fib retracement level of the downward move from the $188 swing high to the $163 low.
Solana is now trading below $175 and the 100-hour moving average. On the upside, immediate resistance is around the $170 level. The next major resistance is near the $175 level or the 50% Fib retracement level of the downward move from the $188 swing high to the $163 low.
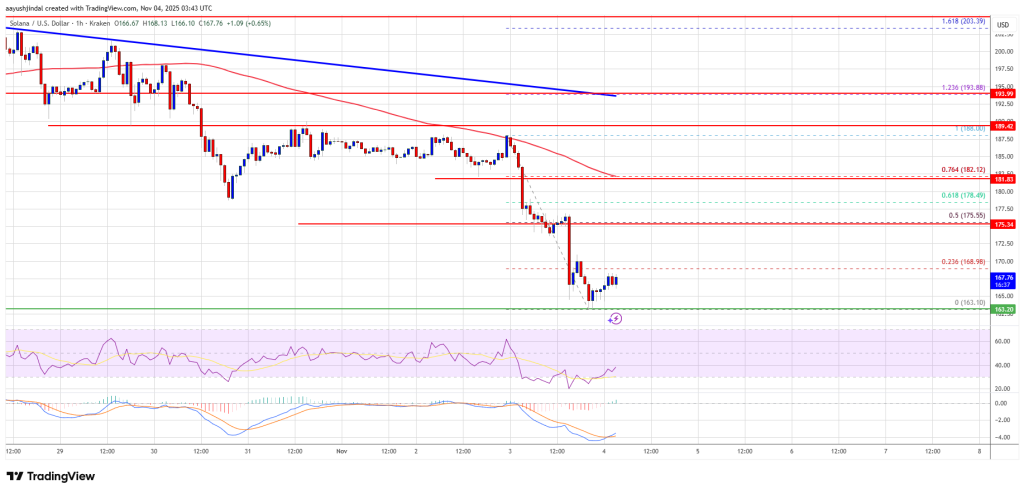
The key resistance could be at $182. A successful close above the $182 resistance zone could set the pace for another steady rise. The next major resistance is $190. There is also a major bearish trendline forming with resistance at $191 on the hourly chart of the SOL/USD pair. Any further gains could send the price towards the USD 200 level.
Another drop in the SOL?
If SOL fails to rise above the USD 175 resistance, the price could continue to decline. The initial downside support is near the $165 zone. The first major support is near the $162 level.
A break below the $162 level could send the price towards the $154 support zone. If there is a close below the $154 support, the price could fall towards the $150 support in the near term.
Technical indicators
Hourly MACD – The MACD for SOL/USD is gaining speed in the bearish zone.
Hourly RSI (Relative Strength Index) – The RSI for SOL/USD is below the 50 level.
Major support levels – USD 165 and USD 162.
Major resistance levels – $175 and $182.