

Bitcoin price failed to initiate a recovery wave above the USD 61,500 resistance zone. BTC started to fall again and could dive to $55,000.
- Bitcoin started a new decline and traded below the $58,500 zone.
- The price is trading below $60,000 and the 100 hourly Simple Moving Average.
- A major bearish trendline is forming with resistance at $58,350 on the hourly chart of the BTC/USD pair (data feed from Kraken).
- The pair could struggle to start a new rise above the USD 60,000 resistance zone.
Bitcoin Price Extends Losses
Bitcoin price struggled to mount a decent recovery wave above the USD 61,500 resistance level. The bears continued to act, pushing BTC below the $60,000 support zone. There was a sharp decline below the USD 58,500 level.
The price even spiked below the $57,000 level. A low was formed at $56,650 and the price is now consolidating losses. It appears that the bulls are struggling to initiate a recovery wave from the $56,650 level as the price is now well below the 23.6% Fib retracement level of the downward move from the $63,800 swing high to the $56,650 low.
Bitcoin price is now trading below $60,000 and the 100 Hourly Simple Moving Average. There is also a major bearish trendline forming with resistance at $58,350 on the hourly chart of the BTC/USD pair.
If there is a decent increase, the price may encounter resistance near the USD 57,500 level. The first major resistance is near the $58,350 level and trendline. A clear move above the trendline could send the price towards the $60,000 level.
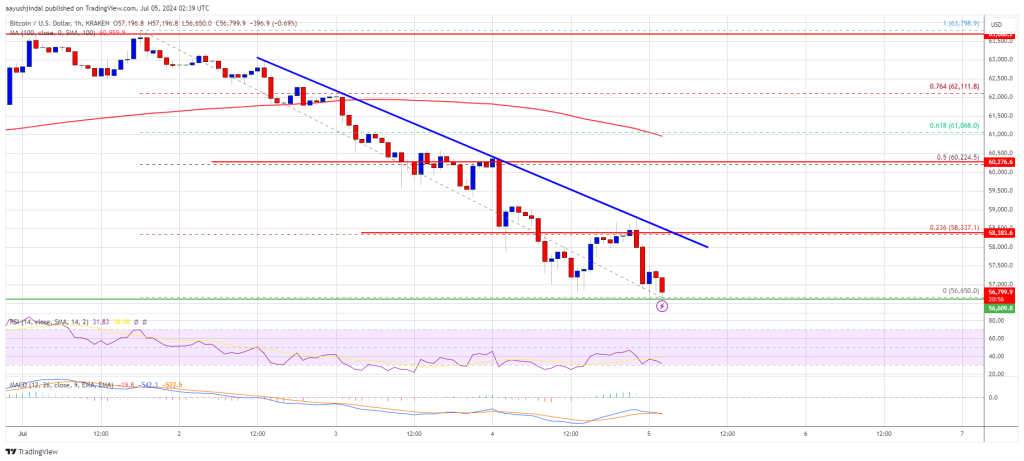
The next major resistance could be $60,200 and the 50% Fib retracement level of the downward move from the $63,800 swing high to the $56,650 low. A clear move above the USD 60,200 resistance could trigger a steady rise and send the price higher. In the mentioned case, the price could rise and test the USD 61,500 resistance.
Lose more in BTC?
If Bitcoin fails to climb above the USD 58,350 resistance zone, it could continue to decline. The immediate downside support is near the $56,650 level.
The first major support is at $56,200. The next support is now near $55,800. Any further losses could send the price towards the $55,000 support zone in the near term.
Technical indicators:
Hourly MACD – The MACD is now gaining speed in the bearish zone.
Hourly RSI (Relative Strength Index) – The RSI for BTC/USD is now below the 50 level.
Major support levels – USD 56,650, followed by USD 55,000.
Major resistance levels – $58,350 and $60,000.