

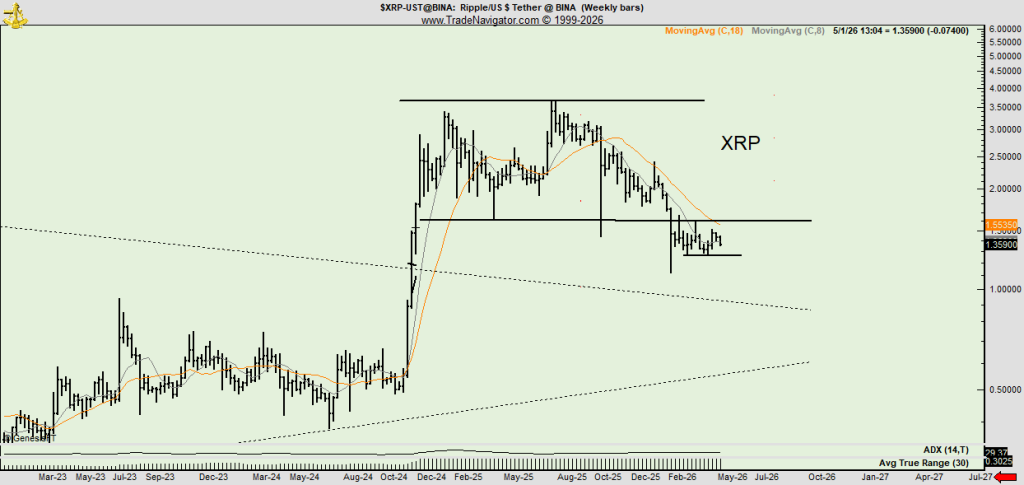
Veteran trader Peter Brandt has shared a weekly chart and asked traders how deep they think XRP could fall into support. The post is important because Brandt’s chart does not view XRP as a pure momentum breakout, but as a market still trying to prove that range expansion can serve as support in late 2024.
Brandt, posted from the @PeterLBrandt account on addressed directly to the XRP audience. “Attention all Ripplettes,” he wrote. “How deep into support do you think the price could go? XRP. See chart.”
What this means for XRP
The chart accompanying the post showed XRP/USDT on Binance on a weekly time frame. Brandt outlined a broad structure that starts with XRP’s long base through 2023 and much of 2024, then the sharp vertical breakout in late 2024, followed by a broad consolidation and eventual pullback. The key level near $1.55 appears to be central to the setup. In technical terms it is a former range reclaim.
Related reading
That $1.55 area also explains why Brandt’s chart is uncomfortable for bulls. XRP has already fallen. Once a market loses previous reach, technicians often look for the next areas where buyers previously absorbed supply. Brandt’s lower horizontal lines appear to map these zones: one near the recent consolidation lows, another around the deeper post-breakout support, and then the broader rising base that defined XRP’s structure before the breakout.
The poll accompanying the post made that support map explicit. Brandt offered four choices: “Bottom is in,” “Support at .93xx,” “Support at .72xx,” and “Slightly above zero.”
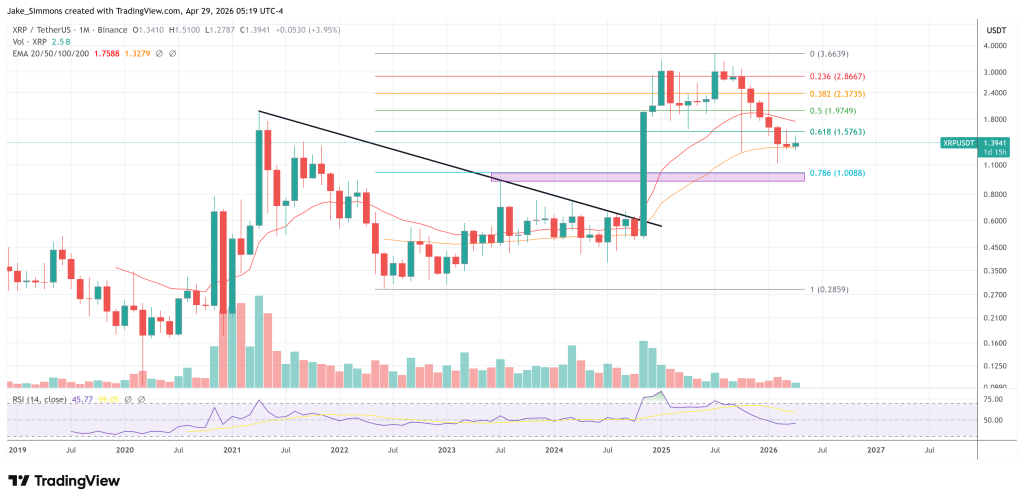
The $0.93 area appears to be coming from a descending trendline that originated at the 2021 high. The $0.72 area is deeper. On the weekly chart, it lines up with the rising trendline of XRP’s old 2023-2024 base and the rising long-term support line that preceded the late 2024 move. In other words, it’s not just a random number. It represents a possible complete retest of the previous breakout structure.
The broader pattern that Brandt seems to highlight is a failed or stressed breakout after a major advance. XRP broke out of a long streak of accumulation styles, rising aggressively above $3 and then forming a broad top-like consolidation with multiple failed attempts to break higher.
Related reading
For XRP bulls, the first answer depends on the $1.55 area. If price can regain and hold that level on the weekly time frame, the chart would look more like a deep retest of a breakout zone than a complete structural failure.
A pullback could indicate that buyers are still defending the previous range line and that the market has not completely given up on post-breakout progress. However, without this clawback, the lower support levels in Brandt’s poll become more relevant as the price would remain below the level that previously supported consolidation.
The survey results showed how divided traders were at that risk. ‘Bottom is in’ had 27% of the vote, ‘Back on .72xx’ also had 27%, and ‘Slightly above zero’ got another 27%. The more moderate option, “Support on .93xx,” had 19% and was marked as the selected choice in the screenshot. At the time of writing, the poll had received 364 votes with almost 12 hours to go, with XRP trading at $1.3941.
Featured image created with DALL.E, chart from TradingView.com