

PEPE, one of the top meme coins in the crypto space, is currently at a pivotal point as it approaches its long-standing bullish trendline. As the price approaches the bullish trendline, a break below it could signal a major shift in market sentiment, which could lead to a price drop towards the $0.00000766 mark.
This article provides an in-depth analysis of the current price action, focusing on the bullish trendline. It is explored whether a potential break below this line could push the price towards the critical support level at $0.00000766, or if there is a potential reversal on the horizon.
At the time of writing, PEPE’s price is down 5.10%, trading at around $0.00001005 over the past 24 hours. PEPE has a Market capitalization of more than $4.2 billion and a trading volume of more than $821 million. The asset’s market capitalization has fallen by 5.32%, while trading volume has increased by 35.01% over the past 24 hours.
Technical Analysis: Current Market Sentiment for PEPE
On the 4-hour chart, PEPE has shown a significant bearish trend momentum, with the price falling below the 100-day Simple Moving Average (SMA) and the support mark of $0.00001152, indicating a potential bearish move towards the bullish trendline. A successful break below this trendline could signal the start of a bearish trend for the cryptocurrency, potentially sending the price down to the next major support level at $0.00000766.
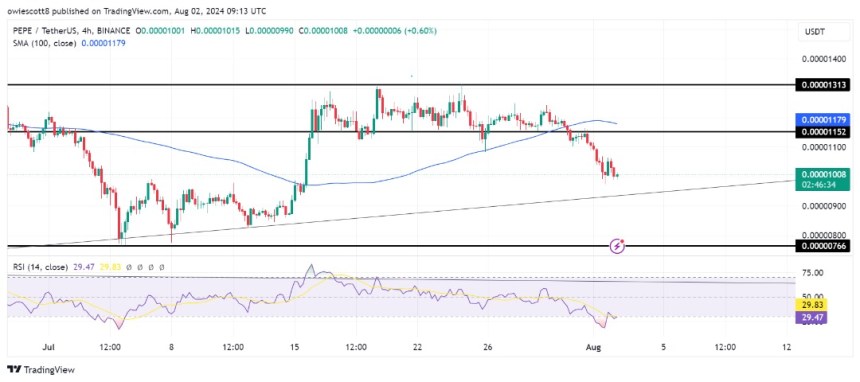
Furthermore, the Relative Strength Index (RSI) signal line on the 4-hour chart has fallen below 50% and is approaching 30%, which is considered the oversold zone. This move signals increasing bearish momentum and suggests that selling pressure is increasing.
Technical analysis on the 1-day chart shows that after the rejection at $0.00001313, PEPE has followed a bearish trajectory towards the optimistic trendline, marked by the formation of multiple bearish candlesticks. Furthermore, the crypto asset’s price is trading below its 100-day SMA, indicating bearish market sentiment.
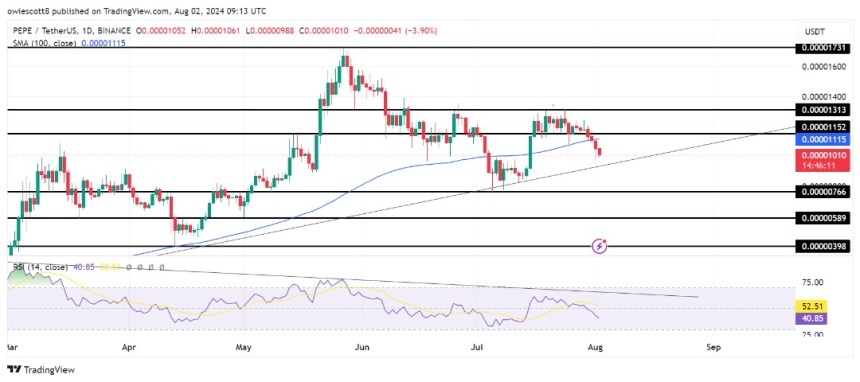
The signal line of the 1-day RSI indicator has recently dipped below 50% and is moving towards the oversold zone, indicating that the digital asset could continue its bearish trajectory below the 100-day SMA towards the bullish trendline.
Navigate potential breakdowns and bounces on the trendline
PEPE is currently on a bearish path and approaching its long-standing bullish trendline. A successful break below this trendline could signal the start of a bearish trend, potentially pushing the asset towards the $0.00000766 support level and beyond.
Like PEPE bounces back on the bullish trendline, it could return to the previous high of $0.00001152. Should the crypto asset break above this level, it could signal further upward movement, possibly targeting the $0.00001313 resistance range and other higher levels.
Featured image from iStock, chart from Tradingview.com