

Bitcoin price is struggling to recover above $26,500. BTC is clearly struggling and there is a risk of a downside breakout in the near term.
- Bitcoin is facing many hurdles above the USD 26,200 resistance zone.
- The price is trading well below $26,000 and the 100 hourly Simple Moving Average.
- A major bearish trendline is forming with resistance near $25,800 on the hourly chart of the BTC/USD pair (data feed from Kraken).
- The pair could take a big hit if the closing price falls below $25,350.
Bitcoin Price Remains in Danger
Bitcoin price remained in a bearish zone and all attempts to initiate a decent recovery failed. BTC peaked near $26,500 and started a new decline.
There was a close below the $26,000 pivot level. The price even peaked below $25,650. A base seems to be forming around the $25,600 level, but upside is still limited. The price is consolidating below the 23.6% Fib retracement level of the downward move from the $26,487 swing high to the $25,650 low.
Bitcoin is also trading well below $26,000 and the 100 hourly Simple Moving Average. Moreover, a major bearish trendline is forming with resistance around $25,800 on the hourly chart of the BTC/USD pair.
The immediate resistance on the upside is near the $25,800 level. The first major resistance is near the $26,050 level or the 50% Fib retracement level of the downward move from the $26,487 swing high to the $25,650 low.
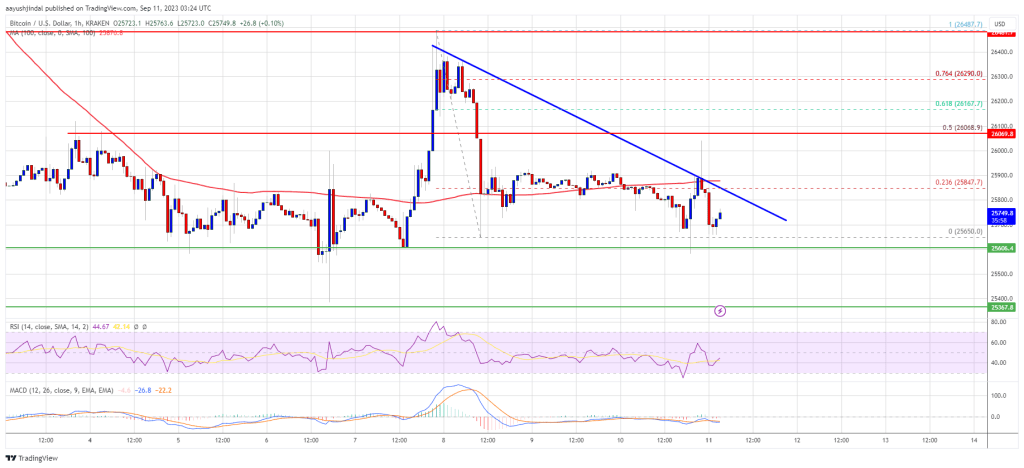
Source: BTCUSD on TradingView.com
The next major resistance is near USD 26,200. A good close above the USD 26,200 level could trigger significant upside. The next major resistance is around $26,500, above which the bulls could gain strength. In the said case, the price could test the $27,000 level.
Lose more in BTC?
If Bitcoin fails to clear the USD 26,200 resistance, it could continue falling. The immediate downside support is near the USD 25,600 level.
The next major support is near the $25,350 level. A downside break and a close below the $25,350 level could increase selling pressure. In the mentioned case, the price could drop to $24,500 or even $24,000.
Technical indicators:
Hourly MACD – The MACD is now losing pace in the bearish zone.
Hourly RSI (Relative Strength Index) – The RSI for BTC/USD is now below the 50 level.
Major support levels – USD 25,600, followed by USD 25,350.
Major resistance levels – $25,800, $26,050 and $26,200.