

- FLOKI has broken out of a bullish triangle pattern after a consolidation phase.
- Should this uptrend continue, FLOKI could return to its previous highs of August and July.
Over the past 30 days, Floki [FLOKI] has shown solid performance, delivering an 8.49% return for investors.
However, the last 24 hours have seen a small setback, with a slight decline of 0.04%, marking a deviation from the stable trajectory.
Emerging developments indicate that FLOKI is poised to adopt a mostly bullish stance in the near future.
Strong advantage for FLOKI
FLOKI has shown two notable bullish patterns on the charts. Initially, a bullish triangle pattern formed with clear diagonal resistance and support lines.
Furthermore, a consolidation channel has developed within this triangle, further emphasizing the bullish sentiment.
Currently, FLOKI has successfully broken out of both the bullish triangle and the consolidation channel, underscoring the strength of the current market momentum.
Should the bullish momentum continue, FLOKI could pursue its next potential targets.
The immediate target is the midpoint of the bullish triangle at 0.00016475, with the channel’s peak shortly afterwards at 0.00021116, marking the highs reached in August and July respectively.
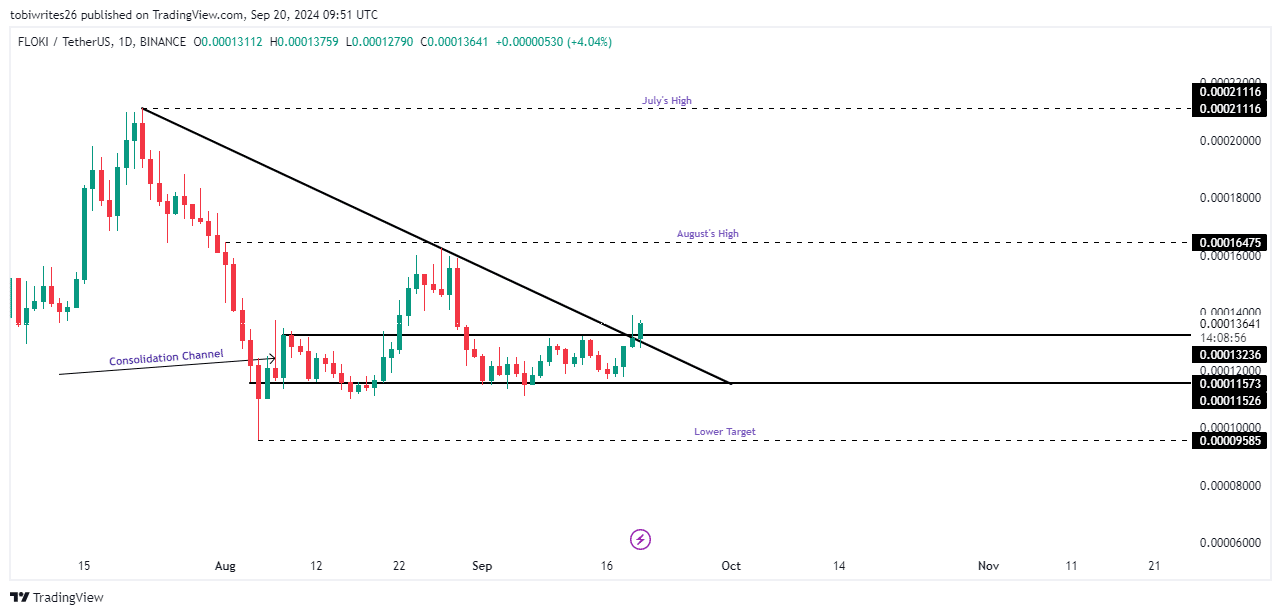
Source: TradingView
However, if momentum wanes, the price may retreat to the basic support level at 0.00011573 and possibly further to 0.00009585.
FLOKI sees increased capital inflow
At the time of writing, the Relative Strength Index (RSI) for FLOKI stood at 56.71, indicating a steady uptrend.
This continued growth suggested that traders were actively buying FLOKI, which is likely to drive further price momentum and continue the uptrend over time.
Moreover, the Money Flow Index (MFI) has been rising since September 17, indicating significant inflows of funds into FLOKI. This increase contributes to a positive, bullish outlook for the asset.
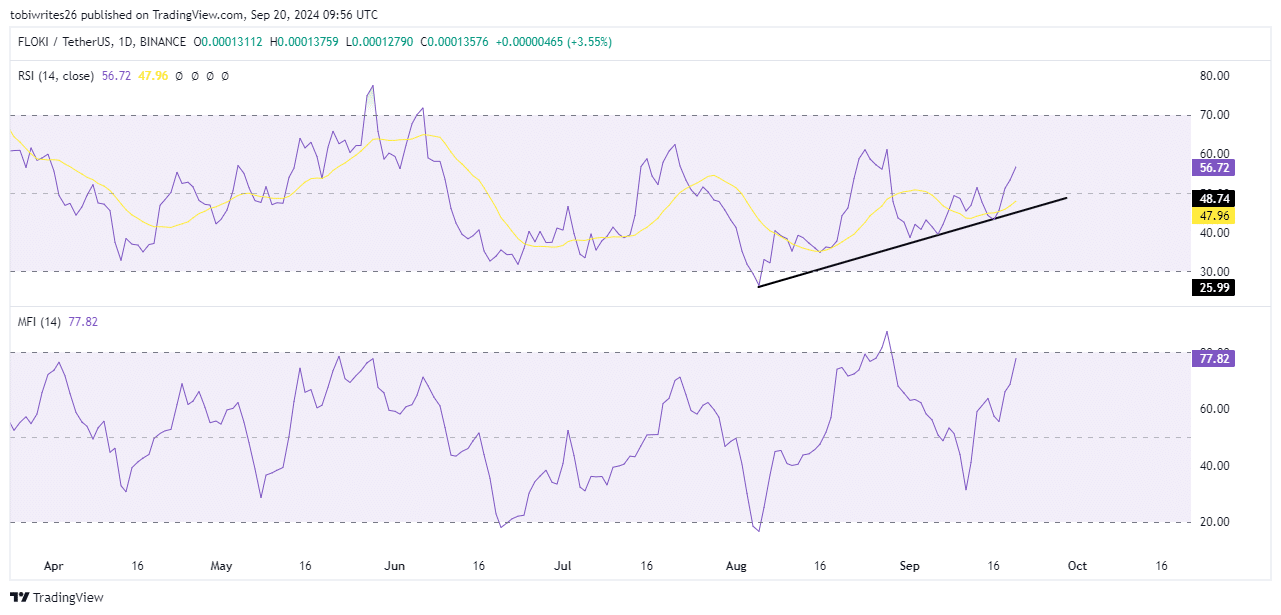
Source: TradingView
The Money Flow Index is a momentum indicator that tracks the flow of money into and out of an asset over a period of time, allowing the assessment of buying and selling pressure.
Traders remain active at FLOKI
According to Santimentthe number of active addresses interacting with FLOKI is remarkably high, indicating continued merchant involvement in the cryptocurrency.
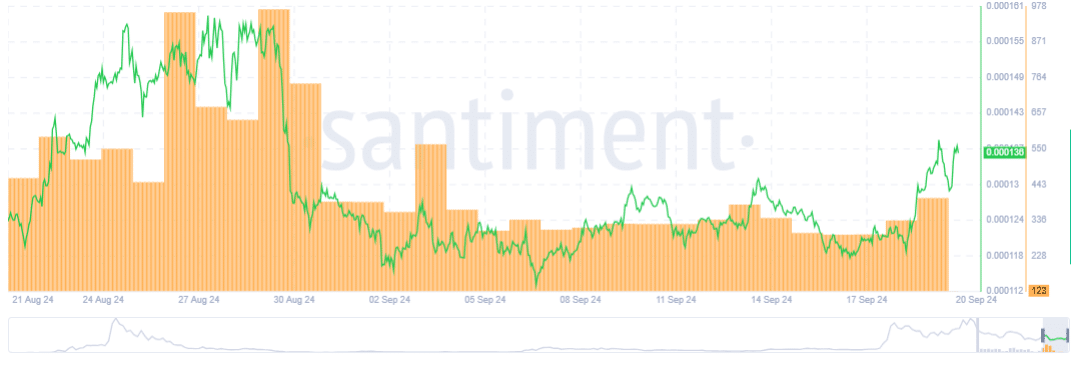
Source: Santiment
Realistic or not, here is FLOKI’s market cap in BTC terms
When such activity grows along with rising prices, it sends a strong bullish signal for the asset. This trend suggests that FLOKI may continue to rise as more trading sessions occur.
Overall, this growing momentum at the peak will see FLOKI trading at the highest target in sight, which is exactly $0.00020994.