

Fidelity Digital Assets argues that Bitcoin’s market structure has shifted so much that the well-known four-year boom-bust pattern and brutal 80% declines that often followed could no longer be the standard outcome.
In a February 24 research note titled “Is Bitcoin’s Four-Year Cycle Over?” research analyst Zack Wainwright frames the call around a simple observation: Bitcoin is now an asset of a very different size with a very different buyer base. Fidelity pegs Bitcoin’s market cap at an all-time high of roughly $2.5 trillion as of October 2025, alongside signs of deeper liquidity and a more stable volatility regime than previous cycles.
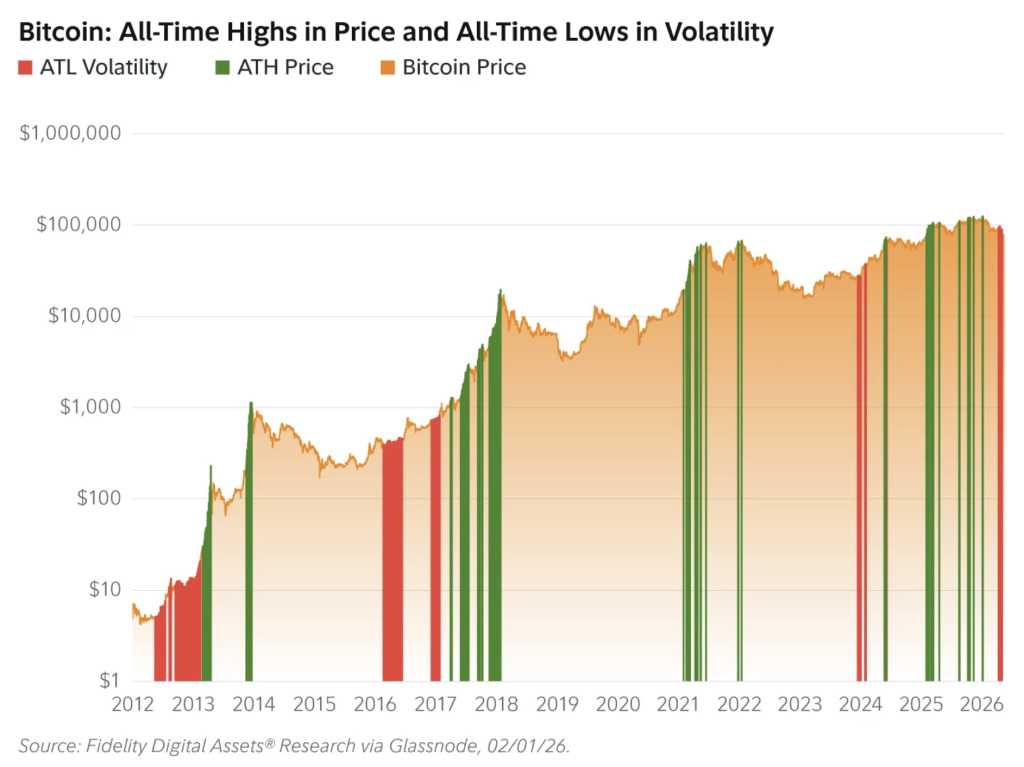
“As Bitcoin matures, price behavior is diverging from previous cycles. Volatility is decreasing even as the price reached new highs above $126,000.”
Demand for Bitcoin is being reshaped
Fidelity’s volatility argument relies on realized volatility over a year and how it behaved around cycle peaks. In previous cycles, the pattern has been broadly consistent: volatility dropped to new lows, ahead of a big upward move to new highs, and then increased as the cycle overheated.
Related reading
This time, Fidelity says the compression arrives earlier after the peak. The note points to 17 new all-time lows in one-year realized volatility recorded in January 2026 – just months after Bitcoin hit new all-time highs in October 2025 – calling this a meaningful departure from the cadence of previous cycles. The team attributes some of this dampening to scale: Bitcoin is about twice the market cap at its 2021 peak, roughly 10x its 2017 peak, and over 200x its 2013 peak.
The second pillar is who is holding the supply and how persistent that demand seems. Fidelity highlights a cohort of 49 publicly traded companies that each own more than 1,000 BTC, with combined assets of more than 1 million BTC, more than 5% of the circulating supply. It also notes that this group has increased its holdings quarter-over-quarter in every quarter since the first quarter of 2020, except for the second quarter of 2022, when Tesla sold a large portion of its position.
On the ETF side, Fidelity writes that US spot Bitcoin ETFs launched in January 2024 and collectively held nearly 1.3 million BTC as of January 30, 2026, about 6.4% of the circulating supply. The note adds that the category leader has surpassed $75 billion in assets under management in less than two years, which contrasts that pace with gold’s ETF, GLD, which took nearly seven years to reach the same milestone.
Together, Fidelity says publicly traded companies and ETFs now control nearly 12% of circulating supply, with most of the growth expected to occur after 2023 – a demand shift that the team believes is structurally important for price declines.
Related reading
Fidelity also said the cycle looked “remarkably stable” across various on-chain and issuance-related measures. Using an earnings window framework, when earnings numbers first cross 95% and the last time they remain above 95%, the note says that the MVRV has remained roughly around two times realized value through most of the bull market, rather than rising to the four to six times as in previous cycles.
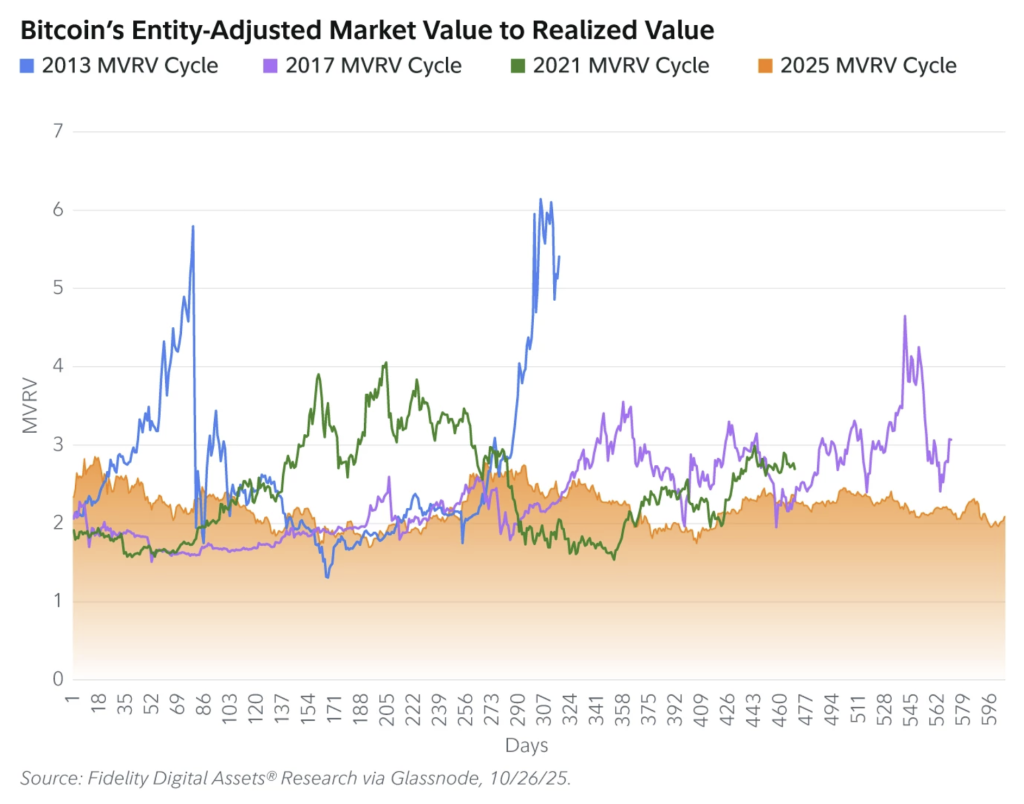
The report points to a counterfactual scenario to illustrate this point: If the market cap were to reach four times the realized limit in this cycle, it would roughly imply a market cap of $4.5 trillion and approximately $225,000 per BTC on February 2, 2026. It also notes that the Puell Multiple has remained close to one, indicating that the daily issuance value has not meaningfully deviated from the annual average.
Fidelity’s new “Profit to Volatility Ratio” is where the drawdown claim becomes explicit. The team sets 0.01 as the stability line and says the ratio has remained above 0.015 since late 2023, the longest sustained period at that level in Bitcoin history. Even with a recession in February 2026 that pushed BTC below $70,000, the ratio remained above the threshold.
“A reading above 0.01 can be considered very stable. Conversely, a reading below 0.01 should be viewed with caution.”
The implication, Fidelity suggests, is not that volatility will disappear – but that classic cycle destruction may be less likely in a market increasingly shaped by institutional channels and a larger, more liquid base. If that regime holds, the next phase could look less like a breakdown top and more like a slower, more methodical repricing, moving higher over time but with fewer resets to the brink.
At the time of writing, BTC was trading at $66,677.
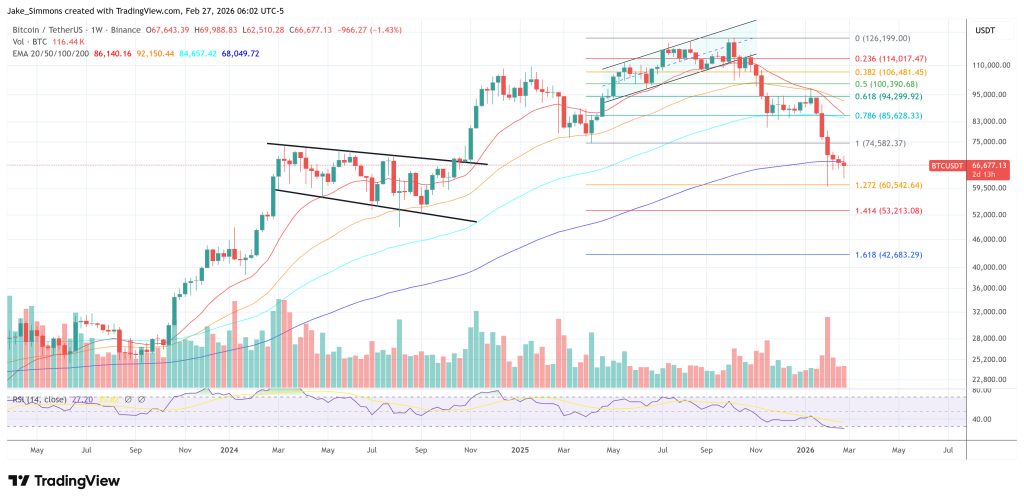
Featured image created with DALL.E, chart from TradingView.com