

Ethereum price found support near USD 1,905 and recouped some losses. ETH is now consolidating and facing significant hurdles near $1,980.
- Ethereum is attempting another recovery wave above $1,950.
- The price is trading below $1,980 and the 100-hourly Simple Moving Average.
- A bearish trendline is forming with resistance at $1,985 on the hourly chart of ETH/USD (data feed via Kraken).
- The pair could start a new decline if it stays below the $2,000 zone.
Ethereum price continues to fall
The price of Ethereum did not stay above $1,950 and started a new decline, just like Bitcoin. ETH price traded below the USD 1,935 and USD 1,920 levels to enter a bearish zone.
Finally, the bulls appeared around $1,900. A low was formed at $1,905, and the price started a recovery wave. There was a move above the resistance at $1,945. The price tested the 38.2% Fib retracement level of the downward move from the $2,038 swing high to the $1,905 low.
Ethereum price is now trading below $1,970 and the 100-hourly Simple Moving Average. If the bulls continue to act above $1,920, the price could rise again. Immediate resistance is seen near the $1,970 level and the 50% Fib retracement level of the downward move from the $2,038 swing high to the $1,905 low.
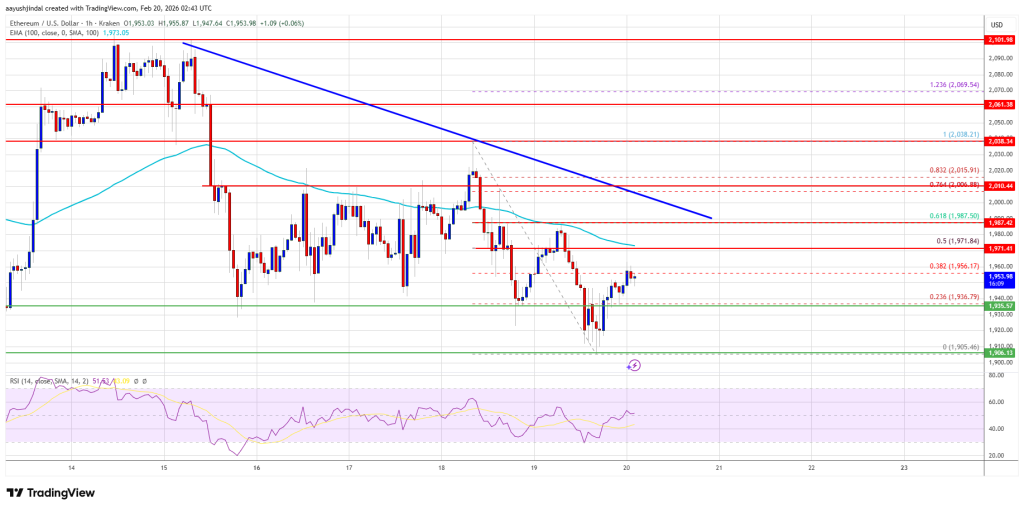
The first major resistance is around the $1,985 level. A bearish trendline is also forming with resistance at $1,985 on the hourly chart of ETH/USD. The next major resistance is around the $2,000 level. A clear move above the USD 2,000 resistance could send the price towards the USD 2,050 resistance. An upside break above the $2,050 region could lead to more gains in the coming days. In the mentioned case, Ether could rise towards the USD 2,120 or even USD 2,150 resistance zone in the short term.
Another drop in ETH?
If Ethereum fails to clear the USD 1,985 resistance, it could trigger another decline. The initial downside support is near the $1,935 level. The first major support is near the $1,905 zone.
A clear move below the USD 1,905 support could push the price towards the USD 1,880 support. Any further losses could send the price towards $1,840. The main support could be at USD 1,820.
Technical indicators
hourly MACD – The MACD for ETH/USD is losing momentum in the bullish zone.
RSI per hour – The RSI for ETH/USD is now above the 50 zone.
Major support level – $1,905
Major resistance level – $1,985