
 Weak rebound attempts, signaling struggle to mount recovery")
Dogecoin started a new decline below the $0.180 zone against the US dollar. DOGE is now correcting some losses and may encounter hurdles near USD 0.1650.
- DOGE price started a new decline below the USD 0.180 level.
- The price is trading below the USD 0.170 level and the 100-hour simple moving average.
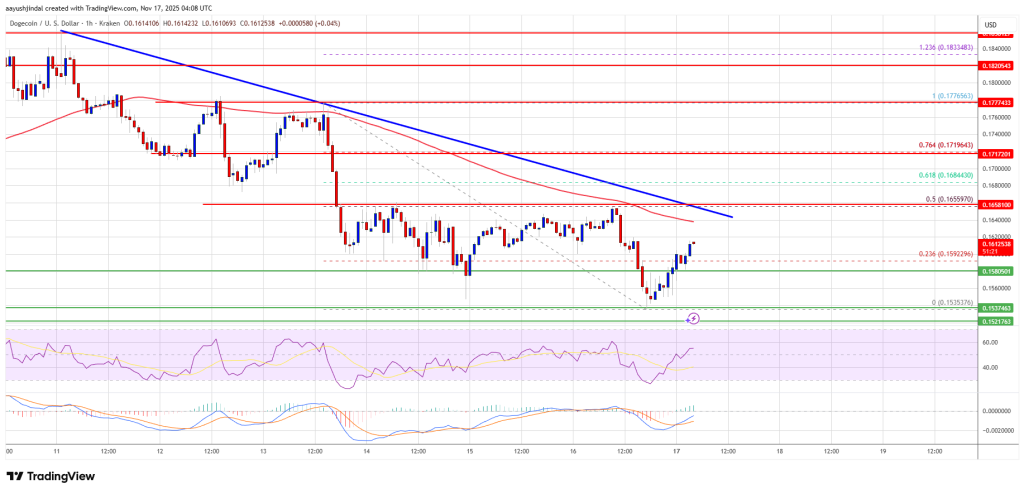
- A bearish trendline is forming with resistance at $0.1650 on the hourly chart of the DOGE/USD pair (Kraken data source).
- The price could extend losses if it remains below USD 0.1650 and USD 0.170.
Dogecoin Price Attempts Recovery
The Dogecoin price started to fall again after closing below $0.20, just like Bitcoin and Ethereum. DOGE fell below the USD 0.180 and USD 0.1720 support levels.
The price even traded below $0.1650. A low was formed near USD 0.1535, and the price recently tried to make a recovery wave. There was a move above the 23.6% Fib retracement level of the downward move from the $0.1776 swing high to the $0.1535 low.
However, the bears were active near the USD 0.1620 resistance. Moreover, a bearish trendline is forming with resistance at $0.1650 on the hourly chart of the DOGE/USD pair. It is close to the 50% Fib retracement level of the downward move from the $0.1776 swing high to the $0.1535 low.
The Dogecoin price is now trading below the $0.1620 level and the 100-hourly moving average. If there is a recovery wave, immediate upside resistance will be around the $0.1640 level. The first major resistance for the bulls could be near the $0.1650 level.
The next major resistance is near the $0.170 level. A close above the USD 0.170 resistance could send the price towards the USD 0.180 resistance. Any further gains could send the price towards the USD 0.1840 level. The next big stop for the bulls could be $0.20.
Lose more at DOGE?
If DOGE price fails to rise above the USD 0.1650 level, it could continue to decline. The initial downside support is near the $0.1550 level. The next major support is near the $0.150 level.
The main support is at $0.1380. If there is a downside break below the USD 0.1380 support, the price could fall further. In the mentioned case, the price could slide towards the $0.120 level or even $0.1050 in the short term.
Technical indicators
Hourly MACD – The MACD for DOGE/USD is now gaining momentum in the bullish zone.
Hourly RSI (Relative Strength Index) – The RSI for DOGE/USD is now above the 50 level.
Major support levels – $0.1550 and $0.1380.
Major resistance levels – $0.1650 and $0.1700.