
 slides deeper into the red: is the bottom in sight?")
Dogecoin started a new decline below the $0.1400 zone against the US dollar. DOGE is now consolidating losses and could encounter hurdles near USD 0.1400.
- DOGE price started a new decline below the USD 0.1400 level.
- The price is trading below the USD 0.1380 level and the 100-hour simple moving average.
- A major bearish trendline is forming at resistance at $0.1375 on the hourly chart of the DOGE/USD pair (Kraken data source).
- The price could extend losses if it remains below USD 0.1400 and USD 0.1420.
Dogecoin price continues to fall
Dogecoin price started falling again after closing below $0.1420, just like Bitcoin and Ethereum. DOGE fell below the USD 0.1400 and USD 0.1380 support levels.
The price even traded below $0.1350. A low was formed near USD 0.1326, and the price recently corrected some losses. There was a small increase towards the 23.6% Fib retracement level of the downward move from the $0.1530 swing high to the $0.1326 low.
The Dogecoin price is now trading below the $0.1400 level and the 100-hourly moving average. If there is a recovery wave, immediate upside resistance will be around the $0.1380 level. There is also a major bearish trendline forming with resistance at $0.1375 on the hourly chart of the DOGE/USD pair.
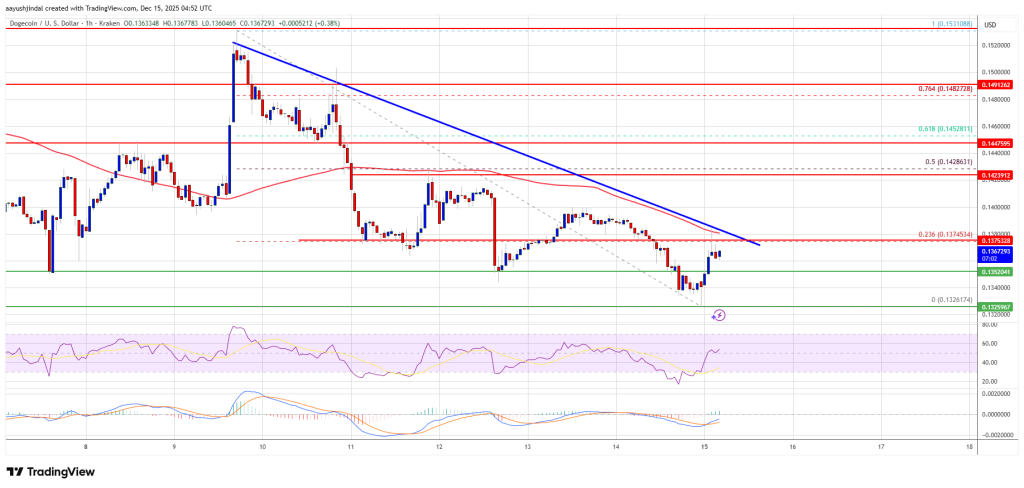
The first major resistance for the bulls could be near the $0.140 level. The next major resistance is near the $0.1425 level and the 50% Fib retracement level of the downward move from the $0.1530 swing high to the $0.1326 low. A close above the resistance at $0.1425 could send the price towards the resistance at $0.1450. Any further gains could send the price towards the USD 0.1500 level. The next big stop for the bulls could be $0.1550.
Another drop in DOGE?
If DOGE price fails to rise above the USD 0.140 level, it could continue to decline. The initial downside support is near the $0.1340 level. The next major support is near the $0.1325 level.
The main support is at $0.130. If there is a downside break below the USD 0.130 support, the price could fall further. In the mentioned case, the price could slide towards the $0.1250 level or even $0.1240 in the short term.
Technical indicators
Hourly MACD – The MACD for DOGE/USD is now gaining momentum in the bearish zone.
Hourly RSI (Relative Strength Index) – The RSI for DOGE/USD is now above the 50 level.
Major support levels – $0.1340 and $0.1300.
Major resistance levels – $0.1400 and $0.1420.