
 recovery capped as momentum turns bearish")
Dogecoin started a new decline below the $0.1050 zone against the US dollar. DOGE is now consolidating losses and could face hurdles near USD 0.10 and USD 0.1040.
- DOGE price started a new decline below the USD 0.1050 level.
- The price is trading below the $0.10 level and the 100-hour simple moving average.
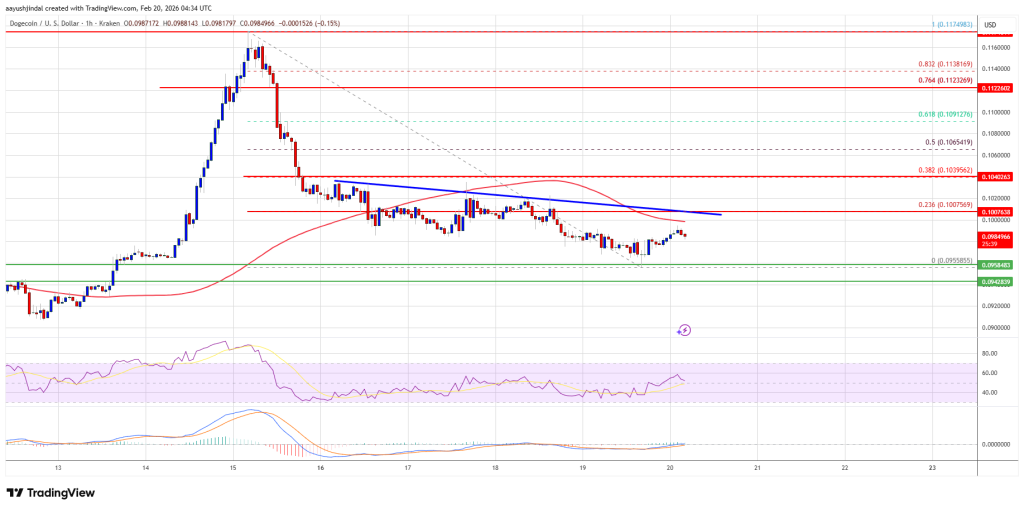
- A major bearish trendline is forming with resistance at $0.1005 on the hourly chart of the DOGE/USD pair (Kraken data source).
- The price could extend losses if it remains below USD 0.1020 and USD 0.1040.
Dogecoin price faces a tough task
The Dogecoin price started to fall again after closing below $0.1050, just like Bitcoin and Ethereum. DOGE fell below the USD 0.1040 and USD 0.1020 support levels.
The price even traded below $0.10. A low was formed near $0.0955, and the price is now showing bearish signs. There was a recovery wave above $0.0980, but the price remained below the 23.6% Fib retracement level of the downward move from the $0.1174 swing high to the $0.0955 low.
The Dogecoin price is now trading below the $0.10 level and the 100-hourly moving average. There is also a major bearish trendline forming with resistance at $0.1005 on the hourly chart of the DOGE/USD pair.
If there is a recovery wave, immediate upside resistance will be around $0.10. The first major resistance for the bulls could be near the $0.1005 level and the trendline. The next major resistance is near the $0.1040 level or the 38.2% Fib retracement level of the downward move from the $0.1174 swing high to the $0.0955 low.
A close above the resistance at $0.1040 could send the price towards the resistance at $0.1065. Any further gains could send the price towards the USD 0.1120 level. The next big stop for the bulls could be $0.1150.
Another drop in DOGE?
If DOGE price fails to rise above the USD 0.1040 level, it could continue to decline. The initial downside support is near the $0.0955 level. The next major support is near the $0.0920 level.
The main support is at $0.0880. If there is a downside break below the USD 0.0880 support, the price could fall further. In the mentioned case, the price could slide towards the $0.0832 level or even $0.0820 in the short term.
Technical indicators
Hourly MACD – The MACD for DOGE/USD is now gaining momentum in the bearish zone.
Hourly RSI (Relative Strength Index) – The RSI for DOGE/USD is now below the 50 level.
Major support levels – $0.0955 and $0.0920.
Major resistance levels – $0.1005 and $0.1040.