
 Consolidates Strength, Calms Down for a New Move?")
Dogecoin started a big rise above $0.1520 against the US dollar. DOGE is now consolidating and could fall if the price falls below $0.140.
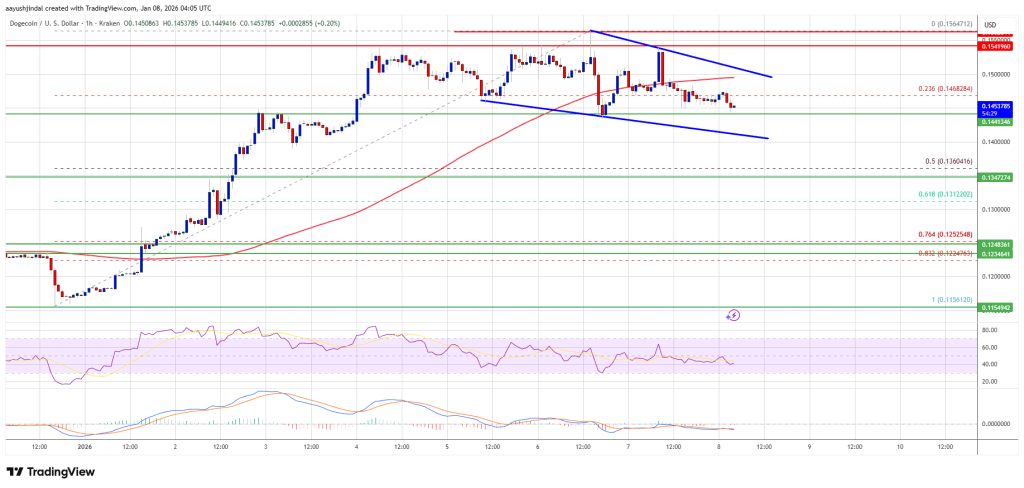
- DOGE price started a new increase above USD 0.1480 and USD 0.1520.
- The price is trading below the USD 0.150 level and the 100-hour simple moving average.
- A contracting triangle is forming with resistance at $0.150 on the hourly chart of the DOGE/USD pair (Kraken data source).
- The price could aim for another increase if it remains stable above USD 0.140.
Dogecoin Price Consolidates Gains
Dogecoin price started to rise again after breaking above $0.1420, just like Bitcoin and Ethereum. DOGE climbed above the resistance at $0.1450 and entered a positive zone.
The bulls managed to push the price above $0.150. A high was formed at $0.1541 and the price is now correcting some gains. There was a move below the 23.6% Fib retracement level of the upward move from the $0.1155 swing low to the $0.1541 high.
The Dogecoin price is now trading below the $0.150 level and the 100-hourly moving average. Furthermore, a contracting triangle is forming with resistance at $0.150 on the hourly chart of the DOGE/USD pair.
If another rise occurs, immediate upside resistance will be around the $0.1480 level. The first major resistance for the bulls could be near the USD 0.150 level. The next major resistance is near the $0.1540 level. A close above the resistance at $0.1540 could send the price towards $0.1625. Any further gains could send the price towards $0.1680. The next big stop for the bulls could be $0.1720.
Lose more at DOGE?
If DOGE price fails to rise above the USD 0.150 level, it could trigger a downside correction. The initial downside support is near the $0.1450 level. The next major support is near the $0.140 level.
The key support is at $0.1360 or the 50% Fib retracement level of the upward move from the $0.1155 swing low to the $0.1541 high. If there is a downside break below the USD 0.1360 support, the price could fall further. In the mentioned case, the price could slide towards the $0.130 level or even $0.1280 in the short term.
Technical indicators
Hourly MACD – The MACD for DOGE/USD is now losing momentum in the bullish zone.
Hourly RSI (Relative Strength Index) – The RSI for DOGE/USD is now below the 50 level.
Major support levels – USD 0.1450 and USD 0.1400.
Major resistance levels – $0.1500 and $0.1540.