
 Caught in Weak Rebound, Bears Still in Lead")
Dogecoin started a recovery wave above the $0.0950 zone against the US dollar. DOGE now faces hurdles near USD 0.10 and could struggle to continue higher.
- DOGE price started a recovery wave from USD 0.090 and climbed above USD 0.0950.
- The price is trading below the USD 0.0960 level and the 100-hour simple moving average.
- A major descending channel is forming with support at $0.090 on the hourly chart of the DOGE/USD pair (Kraken data source).
- The price could continue to rise if it remains above $0.090.
Dogecoin price encounters resistance
Dogecoin price started a recovery wave from the $0.080 zone, like Bitcoin and Ethereum. DOGE climbed above the USD 0.0850 and USD 0.090 resistance levels.
There was quite a bit of upside above the 50% Fib retracement level from the downward move from the $0.1100 swing high to the $0.0800 low. However, the bears remained active near the $0.100 zone. Moreover, a major descending channel is forming with support at $0.090 on the hourly chart of the DOGE/USD pair.
The Dogecoin price is now trading below the $0.0960 level and the 100-hourly moving average. If another recovery wave comes, immediate resistance on the upside will be near the $0.0985 level or the 61.8% Fib retracement level of the downward move from the $0.1100 swing high to the $0.0800 low.
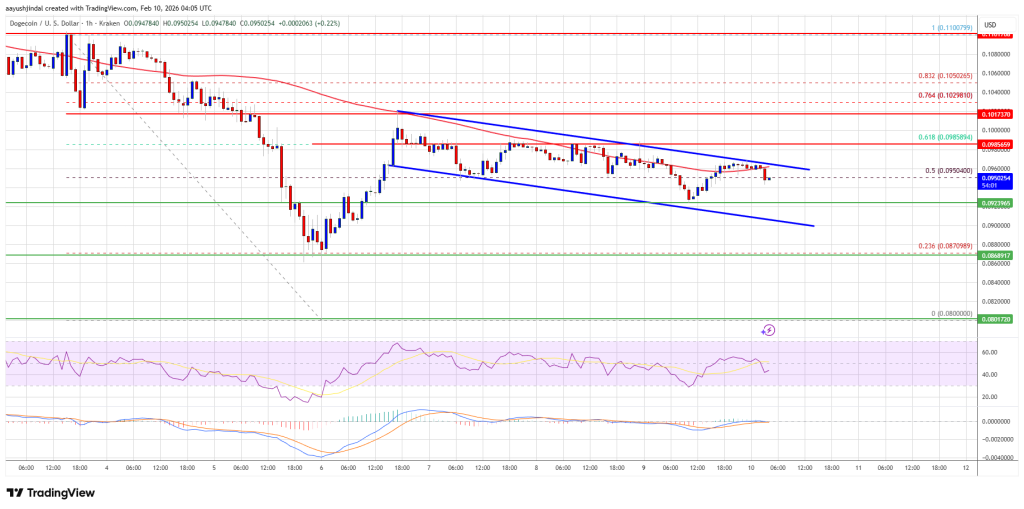
The first major resistance for the bulls could be near the $0.10 level. The next major resistance is near the $0.1020 level. A close above the resistance at $0.1020 could send the price towards the resistance at $0.1085. Any further gains could send the price towards the USD 0.1120 level. The next big stop for the bulls could be $0.1150.
Another drop in DOGE?
If DOGE’s price fails to rise above the USD 0.10 level, it could continue to decline. The initial downside support is near the $0.09240 level. The next major support is near the $0.090 level.
The main support is at $0.0850. If there is a downside break below the USD 0.0850 support, the price could fall further. In the mentioned case, the price could slide towards the $0.0820 level or even $0.0800 in the short term.
Technical indicators
Hourly MACD – The MACD for DOGE/USD is now losing momentum in the bullish zone.
Hourly RSI (Relative Strength Index) – The RSI for DOGE/USD is now below the 50 level.
Major support levels – $0.0924 and $0.0900.
Major resistance levels – $0.0985 and $0.1020.