

BNB has recently fallen below the critical support level at $500, indicating a continuation of a bearish trend. This decline reflects increased selling pressure and growing bearish sentiment within the cryptocurrency market.
With BNB falling below this significant threshold, analysts and traders are closely monitoring further downward moves, potentially targeting lower support levels. Crossing the $500 mark is a key indicator of continued market weakness, suggesting that BNB may face continued challenges in the near term.
Using technical indicators that provide comprehensive insight into potential future moves, key support levels to watch, and strategies for investors and traders to navigate the ongoing downturn, this article examines the bearish sentiment surrounding BNB price.
At the time of writing, BNB’s share price had fallen by more than 10% and was trading at around $471, with a market valuation of more than $69 billion and a trading volume of more than $2 billion. Over the past 24 hours, BNB’s market capitalization has fallen by 10.88%, while trading volume has increased by 37.43%.
Technical indicators point to continued bearish market conditions
The price of BNB on the 4-hour chart is actively trading bearishly below the 100-day Simple Moving Average (SMA). At the time of writing, the price has skyrocketed to fall down the $500 support point, which has led to more bearishness for the crypto assets.
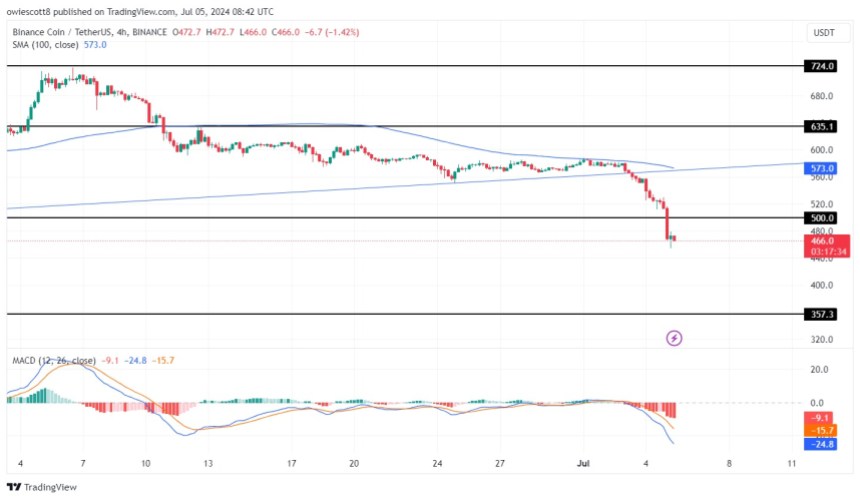
With the formation of the 4-hour Moving Average Convergence Divergence (MACD), the price of BNB will continue to decline as the MACD histograms trend below the zero line with strong momentum. Also, the MACD line and the signal line have fallen sharply and are below the zero line with a good spread.
The 1-day chart shows BNB trading below the 100-day SMA and attempting to drop the third bearish candlestick in a row with strong momentum. This development indicates that the price is still actively bearish and may continue to decline.
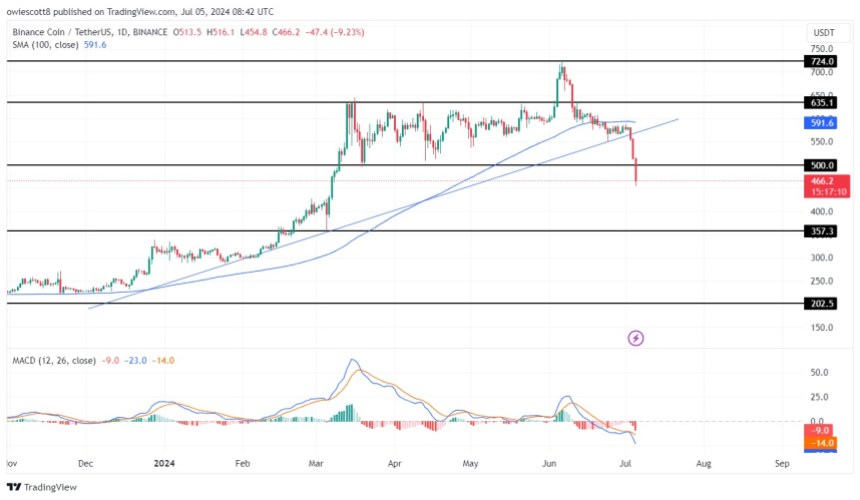
Finally, the 1-day MACD signals a potential further decline in the price of BNB as the MACD histograms trend below the zero line with strong momentum. It is also observed that both the MACD line and the MACD signal line are trending below zero after a cross below it.
What to watch next for BNB
The current analysis shows that the price of BNB could move towards the support level of $357. If the price of BNB reaches the $357 support level and breaks below, the price may continue to decline to test the $202 support level and possibly challenge other lower levels if it crosses the $202 level.
However, should the crypto asset encounter a rejection at the $357 support level, it will start to rise again towards the $500 level. If it breaks above this level, it may continue to rise to test the $635 resistance level and possibly continue to test other higher levels if it crosses the $635 resistance level.
Featured image from Adobe Stock, chart from Tradingview.com