

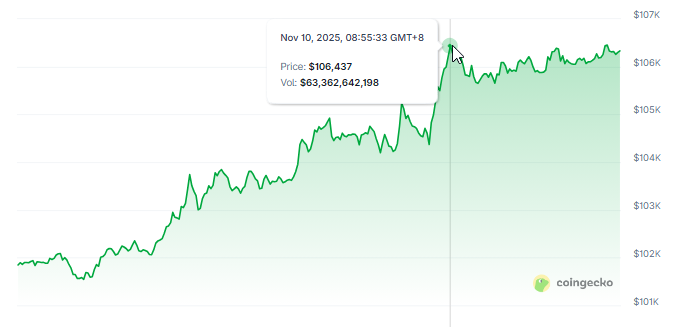
According to Bloomberg Intelligence’s Mike McGlone, Bitcoin has entered a do-or-die phase as traders watch for signs of direction within a narrow price band. From a level of $123,500 on October 6, the coin fell almost 20% to a low of $99,900 on November 4, before recovering to around $106,350. Reports indicate that the move left Bitcoin around 14% below its peak from earlier October.
Related reading
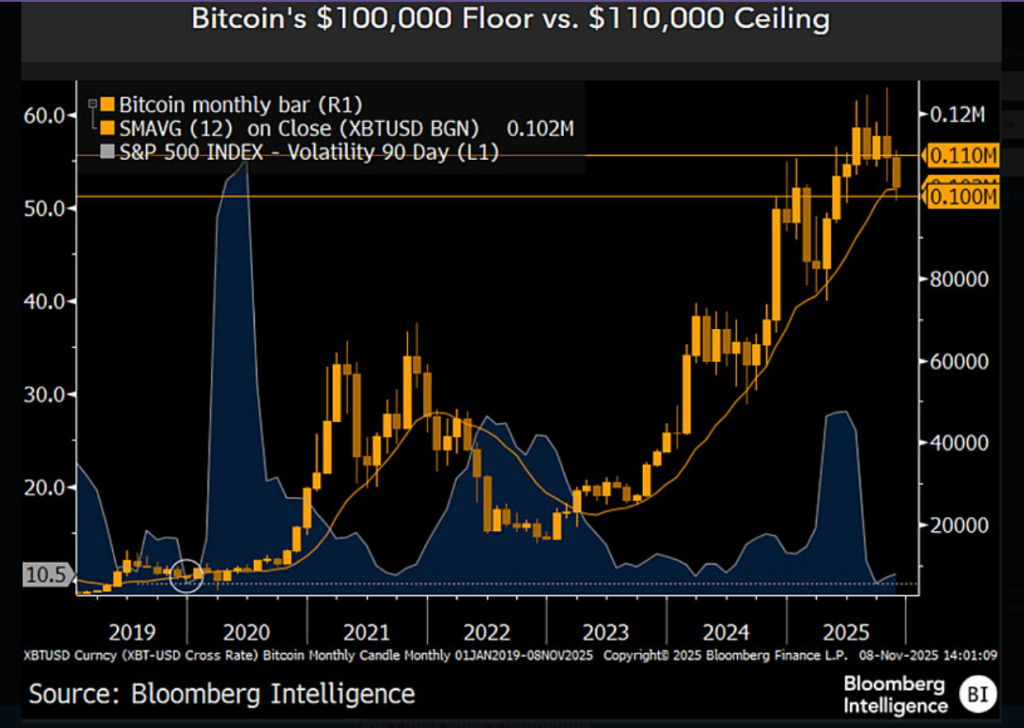
Make or break zone for Bitcoin
Based on trend lines and monthly charts, McGlone points to a rollover pattern after the months-long climb that culminated in a high on October 6, marked on some charts at $126,270. The immediate technical test is the 200-day moving average, which is near $110,000.
Bitcoin Do or Die: $110,000-$100,000
Bitcoin’s rolling pattern on the monthly charts could mean the opposite of gold’s bull flag through August. The crypto has fallen below the 200-day moving average of $110,000 through November 7 – a major hurdle to recovery.
Full report on the… pic.twitter.com/n4MMZfhuL3— Mike McGlone (@mikemcglone11) November 10, 2025
According to his view Bitcoin needs to get back above that level to make a clear case for renewed upside potential. If that doesn’t work, there is a risk that sellers will regain control and prices will fall further below the current range between $100,000 and $110,000.
Resistance and momentum signals
Reports have highlighted other warning signs. Long top wicks have appeared on recent candles, a sign that buyers were being checked at the top. The twelve-month moving average has started to level off after a steady rise, indicating that buying urges are waning.
Trader and analyst Michaël van de Poppe has pointed to strong resistance in the $108,000-$110,000 zone. According to him, breaking that range could open the door to the highs, and if that happens, altcoins could outperform Bitcoin.
Institutional movements and market sentiment
Institutional buyers remain active. Michael Saylor’s company bought 487 BTC is worth almost $50 million today, bringing its reported holdings to 641,692 BTC. At the same time, exchange-traded funds saw outflows totaling $1.22 billion last week.
Market sentiment is up, with CoinMarketCap’s Fear and Greed Index rising from 24 to 29, and Bitcoin is up about 3.6% in the past 24 hours after lawmakers proposed a US government shutdown deal.
Traders are touting event contract odds that give a 28% chance of Bitcoin reaching $130,000 or higher this year, and a 9% chance of exceeding $150,000.
Short-term triggers can tip the balance
There are short-term catalysts at play. US President Donald Trump mentioned a possible tariff of $2,000 “dividend” and progress toward ending the shutdown appear to have fueled the recent rebound.
Timothy Misir, head of research at Blockhead Research Network, said the market has a cleaner positioning and a constructive November if tax clarity and ETF flows stabilize.
He also warned of risks: continued ETF outflows, delays in the delivery of fiscal measures and rising market debt could reverse the recovery.
Related reading
What to watch next
For now, Bitcoin is in a tight trading range. Reclaiming $110,000 would be read as a positive signal and could restore buying confidence. A drop below $100,000 would likely lead to bigger losses, according to the technical view cited by analysts.
Traders and institutions will keep a close eye on the price action around these levels – and these moves will determine whether this moment is remembered as a brief pause or as a major turning point.
Featured image from The Conversation/Landmark Media/Alamy, chart from TradingView