

Bitcoin price is trying to recover above $107,500 and $108,000. BTC could continue to rise if it breaks the USD 109,500 resistance zone.
- Bitcoin started a new recovery wave above the $105,000 resistance level.
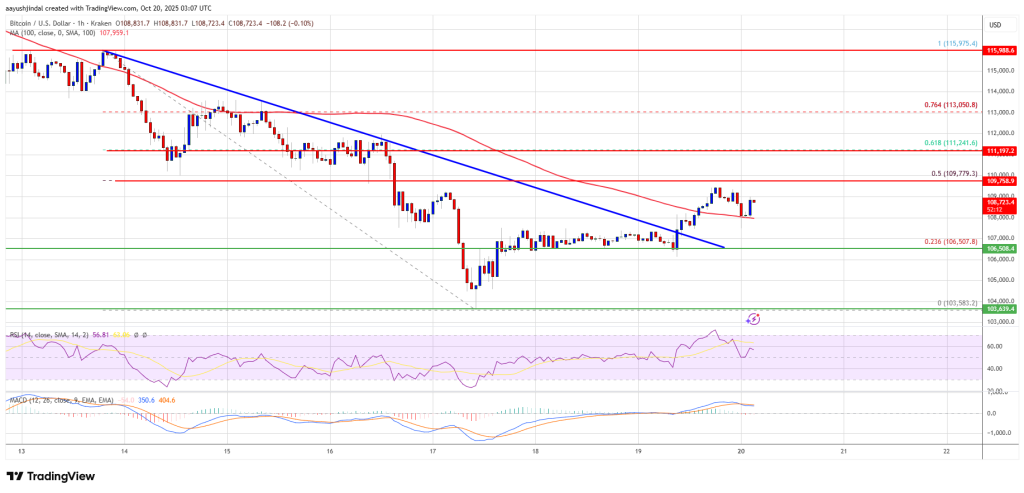
- The price is trading above $108,000 and the 100 hourly Simple Moving Average.
- There was a break above a bearish trendline with resistance at $107,500 on the hourly chart of the BTC/USD pair (data feed from Kraken).
- The pair could continue to rise if it trades above the $109,500 zone.
Bitcoin Price Eyes recovery
Bitcoin price failed to surpass the USD 110,000 resistance level and started a new decline. BTC fell below the USD 108,000 and USD 106,500 support levels and entered a bearish zone.
The price even dropped below $105,000. A low was formed at $103,583 and the price is correcting some losses. There was a move above the 23.6% Fib retracement level of the recent decline, from the $115,975 swing high to the $103,583 low.
Moreover, there was a break above a bearish trendline with resistance at $107,500 on the hourly chart of the BTC/USD pair. Bitcoin is now trading above $108,000 and the 100 hourly Simple Moving Average.
The immediate resistance on the upside is near the $109,500 level. The first major resistance is around the $110,000 level. The next resistance could be $111,250 and the 61.8% Fib retracement level from the recent decline from the $115,975 swing high to the $103,583 low.
A close above the resistance at $111,250 could send the price rising further. In the mentioned case, the price could rise and test the USD 112,500 resistance. Any further gains could send the price towards the USD 113,200 level. The next threshold for the bulls could be $115,000.
Another drop in BTC?
If Bitcoin fails to rise above the $110,000 resistance zone, it could start a new decline. Immediate support is approaching the $108,000 level. The first major support is near the $107,500 level.
The next support is now near the $106,200 zone. Any further losses could send the price towards the USD 105,500 support in the near term. The key support is at $103,500, below which BTC could struggle to recover in the near term.
Technical indicators:
Hourly MACD – The MACD is now gaining speed in the bullish zone.
Hourly RSI (Relative Strength Index) – The RSI for BTC/USD is now above the 50 level.
Major support levels – $108,000, followed by $106,500.
Major resistance levels – $109,500 and $111,250.