

Bitcoin’s price started a steady rise above $70,500 and $72,500. BTC is now consolidating and could target another surge above $72,500.
- Bitcoin started a new surge after settling above the $70,000 zone.
- The price is trading above $70,000 and the 100 hourly moving average.
- A bullish trendline is forming with support at $69,000 on the hourly chart of the BTC/USD pair (data feed from Kraken).
- The pair could fall again if it trades below the $70,000 and $69,000 levels.
Bitcoin Price Begins Downward Correction
Bitcoin price extended its rise above the $68,500 zone. BTC gained pace for a move above the $70,000 resistance zone. The price even rose above the USD 72,000 resistance.
In the end, the bears showed up for almost $74,000. It peaked at $74,062, and the price recently started a downward correction. There was a move below $72,000 and the 23.6% Fib retracement level of the upward move from the $66,164 swing low to the $74,062 high.
Bitcoin is now trading above $70,000 and the 100 hourly moving average. A bullish trendline is also forming with support at $69,000 on the hourly chart of the BTC/USD pair.
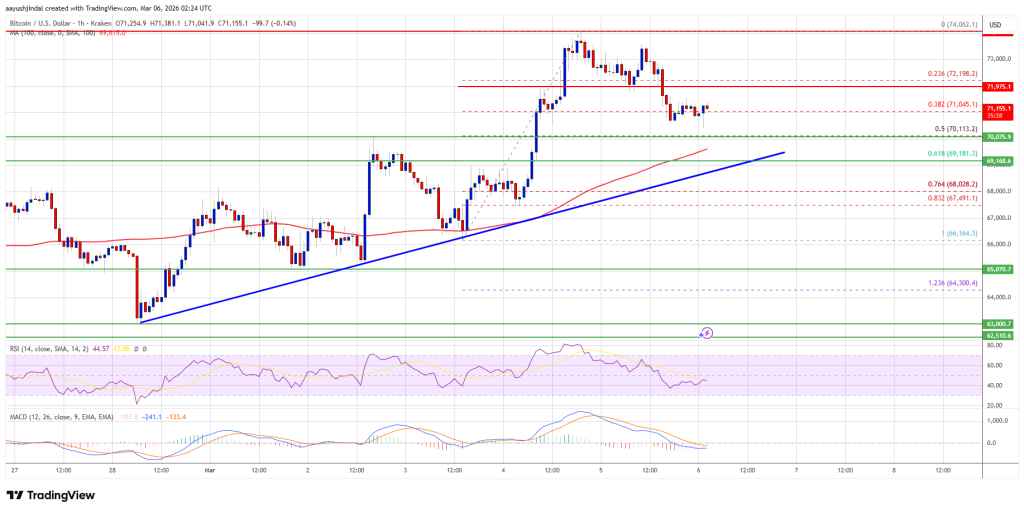
If the price remains stable above $70,000, another increase can be attempted. The immediate resistance is near the $72,000 level. The first major resistance is around the $72,500 level. A close above the USD 72,500 resistance could send the price rising further. In the mentioned case, the price could rise and test the USD 73,200 resistance. Any further gains could send the price towards the $74,000 level. The next barrier for the bulls could be $75,000 and $75,500.
Downward correction in BTC?
If Bitcoin fails to rise above the $72,000 resistance zone, it could trigger another decline. Immediate support is near the $70,000 level or the 50% Fib retracement level of the upward move from the $66,164 swing low to the $74,062 high. The first major support is near the $69,000 level.
The next support is now near the $68,500 zone. Any further losses could send the price towards the USD 68,000 support in the near term. The key support now lies at $66,200, below which BTC could struggle to recover in the near term.
Technical indicators:
Hourly MACD – The MACD is now losing pace in the bullish zone.
Hourly RSI (Relative Strength Index) – The RSI for BTC/USD is now below the 50 level.
Major support levels – USD 70,000, followed by USD 69,000.
Major resistance levels – $72,000 and $72,500.