

Bitcoin price started a recovery wave above $89,500 but failed above $90,000. BTC is falling and could fall further if it breaks $88,000.
- Bitcoin failed to stay above $90,000 and started falling again.
- The price is trading above USD 88,200 and the 100 hourly moving average.
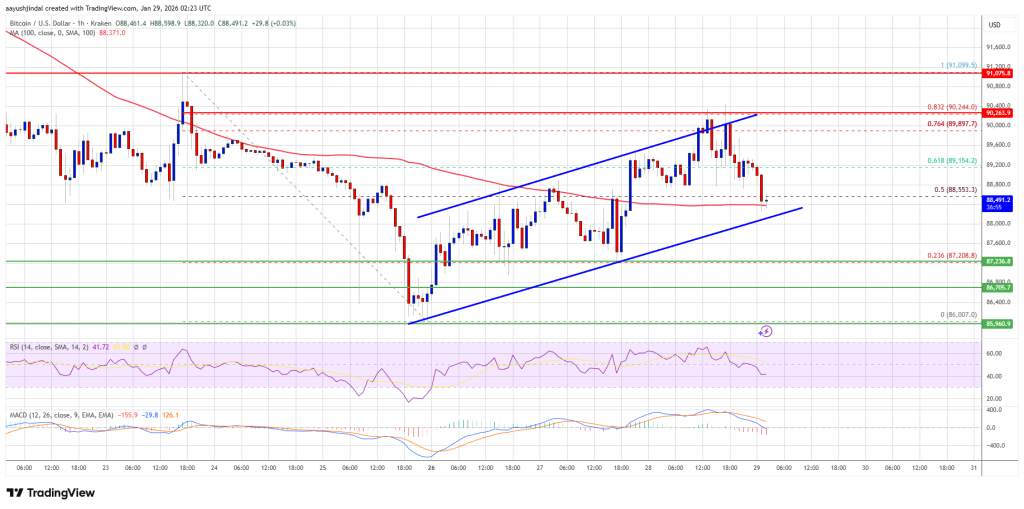
- An ascending channel is forming with support at $88,100 on the hourly chart of the BTC/USD pair (data feed from Kraken).
- The pair could fall further if it trades below the $88,000 and $87,500 levels.
Bitcoin price is rejected
Bitcoin price held steady above the USD 88,000 support. BTC formed a base and recently started a recovery wave above the USD 88,500 level.
The price climbed above the USD 89,000 and USD 89,500 levels. There was a move above the 76.4% Fib retracement level of the downward move from the $91,098 swing high to the $86,007 low. The bulls even pushed the price above $90,000 but failed to keep the price in a positive zone.
There was another decline below $89,000. Bitcoin is now trading above $88,200 and the 100 hourly moving average. Furthermore, an ascending channel is forming with support at $88,100 on the hourly chart of the BTC/USD pair.
If the price remains stable above $88,000, another increase can be attempted. Immediate resistance is near the $89,150 level. The first major resistance is near the $89,800 level. A close above the resistance at $89,800 could send the price higher.
In the mentioned case, the price could rise and test the USD 90,250 resistance. Any further gains could send the price towards the USD 91,200 level. The next barrier for the bulls could be $92,000 and $92,500.
Another rejection in BTC?
If Bitcoin fails to rise above the USD 89,150 resistance zone, it could trigger another decline. The immediate support is near the $88,200 level. The first major support is near the $88,000 level.
The next support is now near the $87,200 zone. Any further losses could send the price towards the $87,000 support in the short term. The key support is at $86,000, below which BTC could struggle to recover in the near term.
Technical indicators:
Hourly MACD – The MACD is now gaining speed in the bearish zone.
Hourly RSI (Relative Strength Index) – The RSI for BTC/USD is now below the 50 level.
Major support levels – USD 88,200, followed by USD 87,000.
Major resistance levels – $89,150 and $89,800.