

Bitcoin price corrected gains and tested the $65,650 zone. BTC is now consolidating losses and could start a significant increase if it breaks above $68,000.
- Bitcoin struggles to make up for losses and falls below $67,500.
- The price is trading below $67,500 and the 100 hourly moving average.
- A descending channel is forming with resistance at $67,400 on the hourly chart of the BTC/USD pair (data feed from Kraken).
- The pair could fall again if it trades below the $66,500 and $66,000 levels.
Bitcoin price faces a tough challenge
Bitcoin price failed to hold steady above the $67,500 zone. BTC started a new decline and traded below the USD 67,200 support zone. There was a drop below $67,000.
The price even peaked below $66,800. A low was formed at $65,650, and the price is now correcting some losses. There was a move above the 50% Fib retracement level from the recent decline from the $68,418 swing high to the $65,650 low.
Bitcoin is now trading below $67,500 and the 100 hourly moving average. If the price remains stable above $66,000, another move up can be attempted. Immediate resistance is near the $67,400 level. A descending channel is also forming with resistance at $67,400 on the hourly chart of the BTC/USD pair. It is close to the 61.8% Fib retracement level of the recent decline from the $68,418 swing high to the $65,650 low.
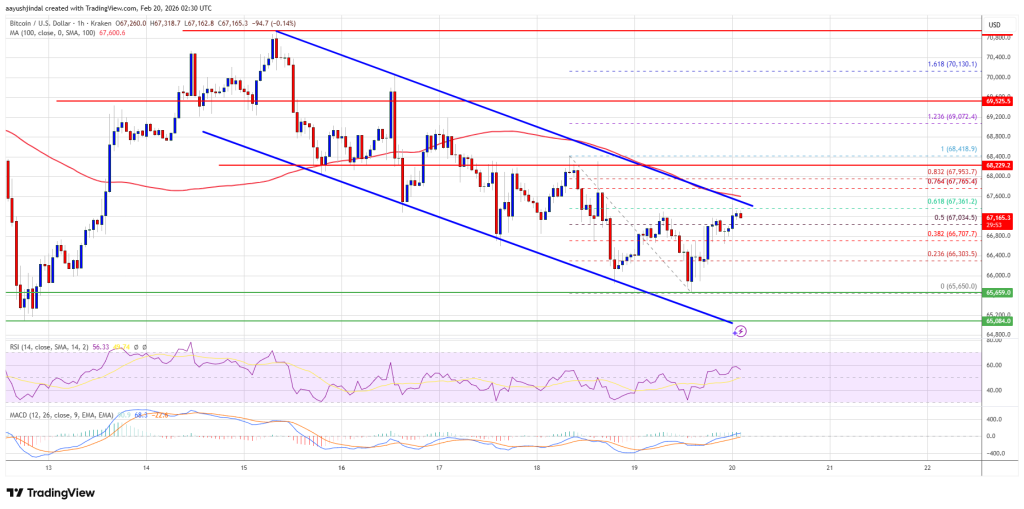
The first major resistance is around the $68,000 level. A close above the USD 68,000 resistance could send the price higher. In the mentioned case, the price could rise and test the USD 68,800 resistance. Any further gains could send the price towards the USD 69,500 level. The next barrier for the bulls could be $70,000 and $70,500.
Another drop in BTC?
If Bitcoin fails to rise above the $68,000 resistance zone, it could trigger another decline. Immediate support is near the $66,000 level. The first major support is near the $65,650 level.
The next support is now near the $65,050 zone. Any further losses could send the price towards the USD 64,500 support in the near term. The key support now lies at $63,800, below which BTC could struggle to recover in the near term.
Technical indicators:
Hourly MACD – The MACD is now losing pace in the bearish zone.
Hourly RSI (Relative Strength Index) – The RSI for BTC/USD is now above the 50 level.
Major support levels – USD 66,000, followed by USD 65,650.
Major resistance levels – $67,400 and $68,000.