

This article is available in Spanish.
Bitcoin price remained supported near the $52,500 zone. BTC is recovering losses and facing hurdles near the USD 55,200 and USD 55,500 levels.
- Bitcoin is struggling to recover above the $55,500 zone.
- The price is trading below $55,200 and the 100 hourly Simple Moving Average.
- A major bearish trendline is forming with resistance at $55,200 on the hourly chart of the BTC/USD pair (data feed from Kraken).
- The pair could struggle to recover above the $55,500 or $56,000 resistance levels in the near term.
Bitcoin price aims for recovery
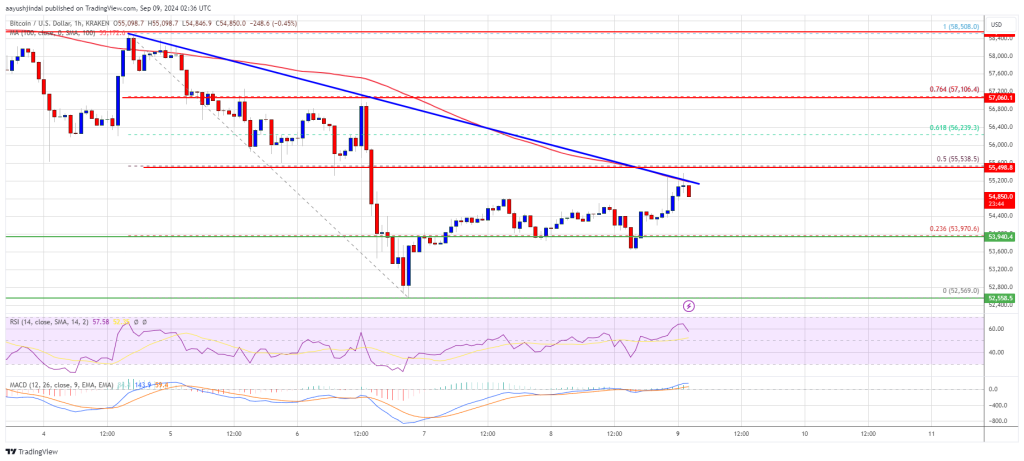
Bitcoin price remained in a bearish zone and extended losses below the USD 55,500 support zone. BTC even fell below the USD 53,200 level. It tested the $52,500 zone. A low was formed at $52,569 and the price is now trying to make a recovery wave.
There was a move above the USD 53,200 and USD 54,000 resistance levels. It cleared the 23.6% Fib retracement level of the downward move from the $58,508 swing high to the $52,569 low. However, the price is now struggling to recover above the $55,500 zone.
Bitcoin is now trading below $55,200 and the 100 hourly Simple Moving Average. On the upside, the price could encounter resistance near the USD 55,200 level. There is also a major bearish trendline forming with resistance at $55,200 on the hourly chart of the BTC/USD pair.
The trendline is close to the 50% Fib retracement level of the downward move from the $58,508 swing high to the $52,569 low. The first major resistance is around the $55,500 level. A clear move above the USD 55,500 resistance could push the price further higher in the coming sessions.
The next major resistance could be at USD 56,200. A close above the resistance at $56,200 could provide more upside. In the mentioned case, the price could rise and test the USD 57,500 resistance.
Another drop in BTC?
If Bitcoin fails to rise above the USD 55,500 resistance zone, it could trigger another decline. The immediate downside support is near the $54,000 level.
The first major support is at $53,200. The next support is now near the $52,500 zone. Any further losses could send the price towards the USD 51,800 support in the short term.
Technical indicators:
Hourly MACD – The MACD is now losing pace in the bullish zone.
Hourly RSI (Relative Strength Index) – The RSI for BTC/USD is now above the 50 level.
Major support levels – USD 54,000, followed by USD 53,200.
Major resistance levels – $55,200 and $55,500.