

Bitcoin price is still struggling to clear the $31,000 resistance. BTC is trading in a range and could revisit the $30,000 support zone.
- Bitcoin is consolidating above the $30,000 support zone.
- The price is trading just below $30,500 and the 100 Simple hourly moving average.
- There was a break above a major bearish trendline with resistance near USD 30,300 on the hourly chart of the BTC/USD pair (Kraken data feed).
- The pair could correct lower towards $30,000 support or even $29,550.
Bitcoin price encounters resistance
Bitcoin price remained supported near the USD 30,000 zone. BTC traded as low as USD 29,914 and recently started a fresh increase. There was a move above the $30,200 and $30,250 levels.
The price cleared the 50% Fib retracement level of the downward move from the $31,436 swing high to the $29,914 low. In addition, there was a break above a major bearish trendline with resistance near USD 30,300 on the hourly chart of the BTC/USD pair.
However, the bears appear to be active near the $31,000 resistance zone. Bitcoin struggled to clear the 76.4% Fib retracement level of the downward move from the $31,436 swing high to the $29,914 low.
The price is now trading just below $30,500 and the 100 Simple hourly moving average. Immediate resistance is near the $30,680 level. The first major resistance is near the $30,950 level, above which the price could revisit the $31,400 resistance zone.
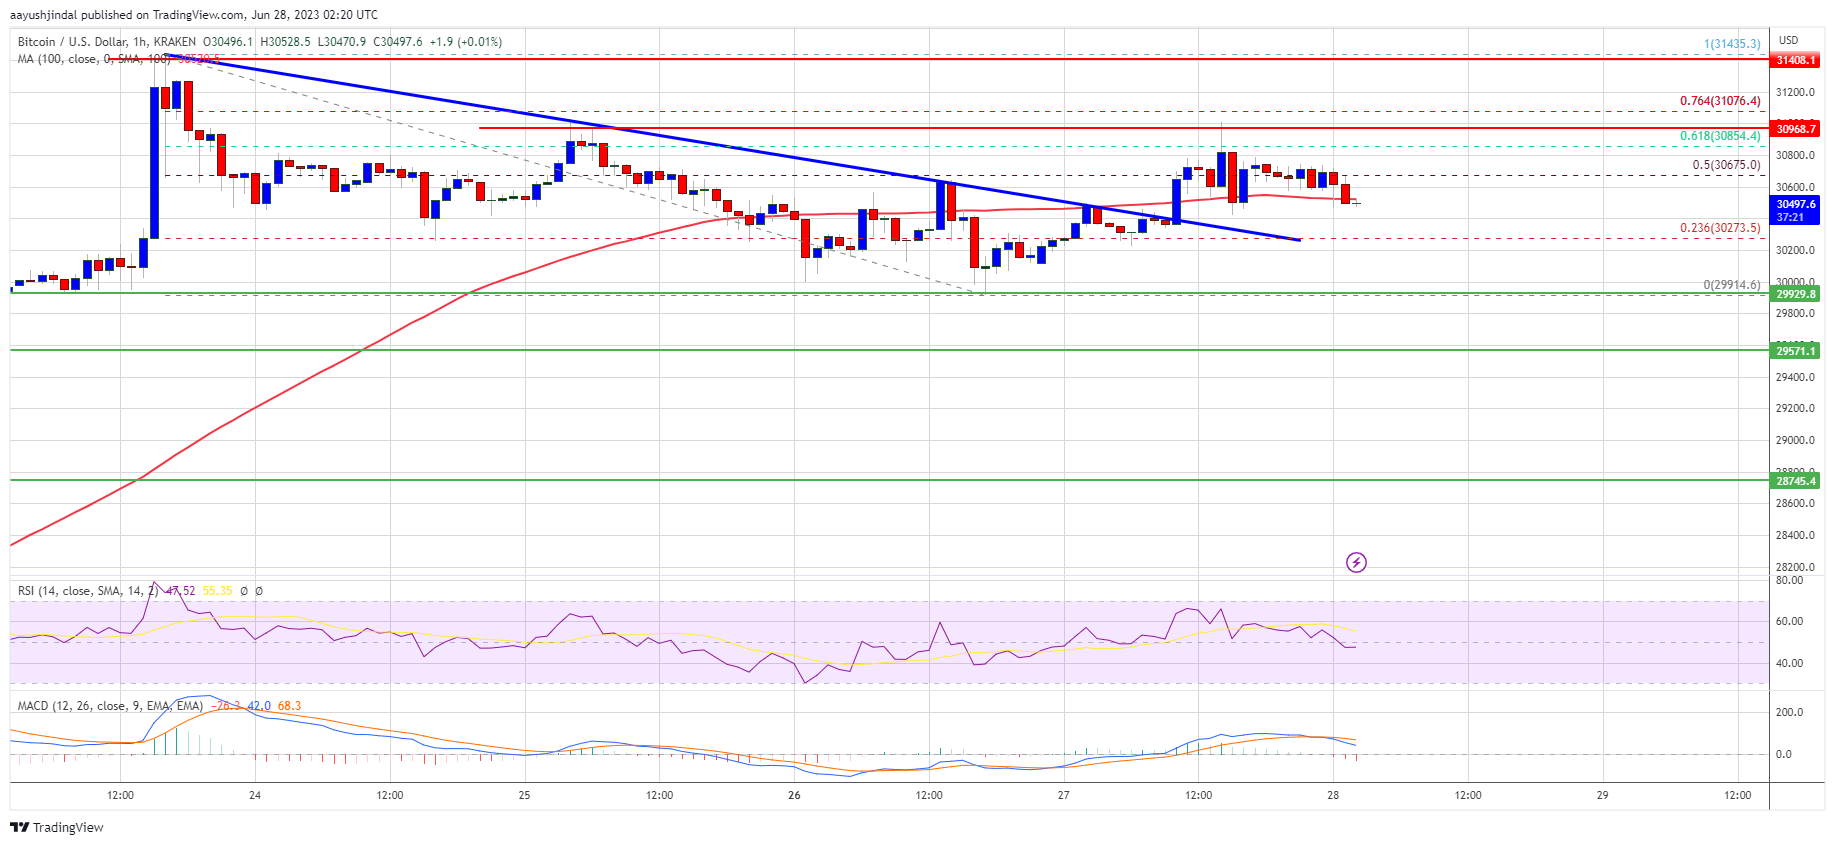
Source: BTCUSD at TradingView.com
The next major resistance is near the USD 32,000 level. An upside break above the USD 32,000 resistance could send BTC towards USD 32,500. More gains could open the door for a move into the $33,200 resistance zone.
Lose more in BTC?
If the price of Bitcoin fails to clear the $30,950 resistance, it could fall further. Immediate support on the downside is near the $30,250 level or broken trendline zone.
The next major support is near the $30,000 level, below which there could be a drop towards the $29,550 support. Any more losses could send the price towards the $28,750 support region in the near term.
Technical indicators:
Hourly MACD – The MACD is now losing pace in the bullish zone.
Hourly RSI (Relative Strength Index) – The RSI for BTC/USD is below the 50 level.
Major Support Levels – $30,000, followed by $29,550.
Major resistance levels – $30,680, $30,950 and $31,400.