

Bitcoin price started a big drop below $80,000. BTC is down more than 10% and could soon test the $70,000 support zone.
- Bitcoin failed to stay above $82,500 and started falling again.
- The price is trading below $80,000 and the 100 hourly moving average.
- A bearish trendline is forming with resistance at $79,200 on the hourly chart of the BTC/USD pair (data feed from Kraken).
- The pair could fall further if it trades below the $75,000 and $74,000 levels.
Bitcoin price drops again
Bitcoin price did not hold steady above the $85,000 zone. BTC started a major decline below the USD 83,200 and USD 82,500 levels. The bears managed to push the price below $80,000.
It spared major bearish moves and pushed the price below $78,000. A low was formed at $75,665, and the price continues to signal more downside. A bearish trendline is also forming with resistance at $79,200 on the hourly chart of the BTC/USD pair.
Bitcoin is now trading below $78,500 and the 100 hourly moving average. If the price remains stable above $75,000, another increase can be attempted. The immediate resistance is near the $78,500 level. The first major resistance is near the $79,200 level or the 23.6% Fib retracement level of the downward move from the $90,440 swing high to the $75,665 low.
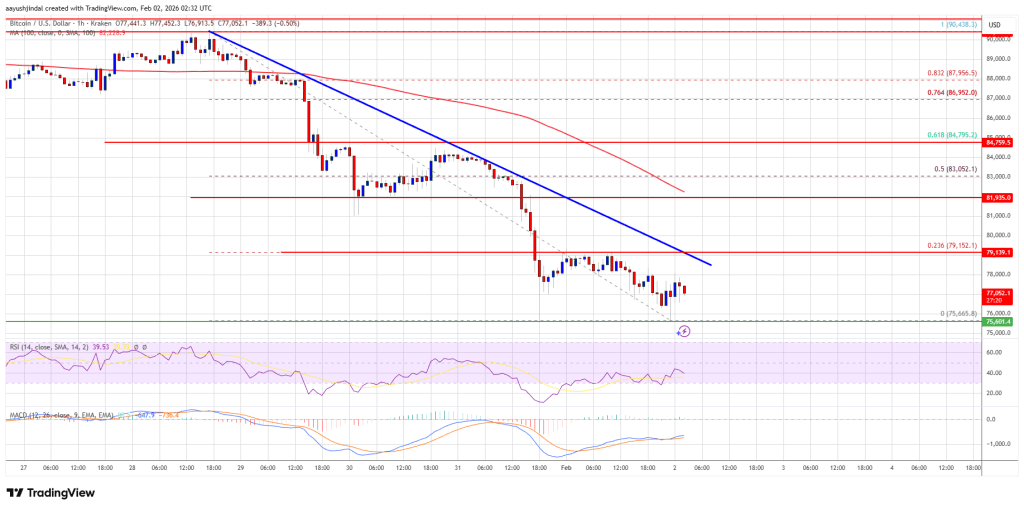
A close above the USD 79,200 resistance could send the price rising further. In the mentioned case, the price could rise and test the USD 82,000 resistance. Any further gains could send the price towards the $83,000 level or towards the 50% Fib retracement level of the downward move from the $90,440 swing high to the $75,665 low. The next barrier for the bulls could be $84,000 and $84,500.
Lose more in BTC?
If Bitcoin fails to rise above the USD 79,200 resistance zone, it could trigger another decline. The immediate support is near the $76,200 level. The first major support is near the $75,500 level.
The next support is now near the $75,000 zone. Any further losses could send the price towards the USD 72,000 support in the near term. The key support is at $70,000, below which BTC could struggle to recover in the short term.
Technical indicators:
Hourly MACD – The MACD is now gaining speed in the bearish zone.
Hourly RSI (Relative Strength Index) – The RSI for BTC/USD is now below the 50 level.
Major support levels – USD 75,500, followed by USD 75,000.
Major resistance levels – $79,200 and $82,000.