

The Bitcoin price did not stay above $70,000 and started to decline again. BTC is now trading below $68,800 and could extend short-term losses.
- Bitcoin is slowly falling below $69,500 and $69,200.
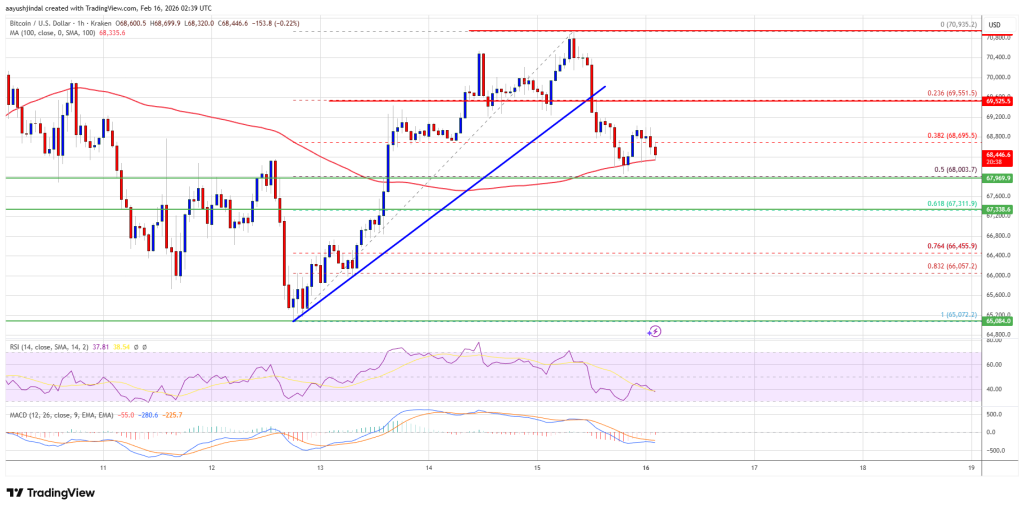
- The price is trading near $68,400 and the 100 hourly simple moving average.
- There was a break below a bullish trendline with support at $69,500 on the hourly chart of the BTC/USD pair (data feed from Kraken).
- The pair could fall again if it trades below the $68,400 and $68,000 levels.
Bitcoin price drops again
Bitcoin price did not hold steady above the $70,000 zone. BTC started a new decline and traded below the USD 69,200 support zone. There was a drop below $69,000.
The price fell below the 38.2% Fib retracement level of the upward move from the $65,072 swing low to the $70,935 high. Moreover, there was a break below a bullish trendline with support at $69,500 on the hourly chart of the BTC/USD pair.
Bitcoin is now trading near $68,400 and the 100 hourly moving average. If the price remains stable above $68,000, another move up can be attempted. The immediate resistance is near the $68,800 level.
The first major resistance is near the $69,500 level. A close above the USD 69,500 resistance could send the price higher. In the mentioned case, the price could rise and test the USD 70,000 resistance. Any further gains could send the price towards the USD 70,500 level. The next barrier for the bulls could be $72,000 and $72,500.
Lose more in BTC?
If Bitcoin fails to rise above the USD 69,500 resistance zone, it could trigger another decline. The immediate support is near the $68,200 level. The first major support is near the $68,000 level or the 50% Fib retracement level of the upward move from the $65,072 swing low to the $70,935 high.
The next support is now near the $67,350 zone. Any further losses could send the price towards the USD 67,350 support in the short term. The key support now lies at $66,500, below which BTC could struggle to recover in the near term.
Technical indicators:
Hourly MACD – The MACD is now gaining speed in the bearish zone.
Hourly RSI (Relative Strength Index) – The RSI for BTC/USD is now below the 50 level.
Major support levels – USD 68,000, followed by USD 66,500.
Major resistance levels – $69,500 and $70,000.